August 14th, 2026

Lamatic.ai has successfully renewed its SOC 2 Type 2 certification, completing its second consecutive annual examination conducted by Prescient Assurance LLC (Nashville, TN) for the period April 1 – July 15, 2026.
Renewal matters. A single SOC 2 report tells you our controls were designed correctly. A renewed report tells you they kept working through infrastructure changes, team changes, and a significantly expanded scope. This cycle is our most comprehensive yet: we expanded coverage to three Trust Service Criteria, overhauled our infrastructure stack, and brought in best-in-class compliance partners to make the audit process more rigorous and repeatable.
Three Trust Service Criteria, Now Verified
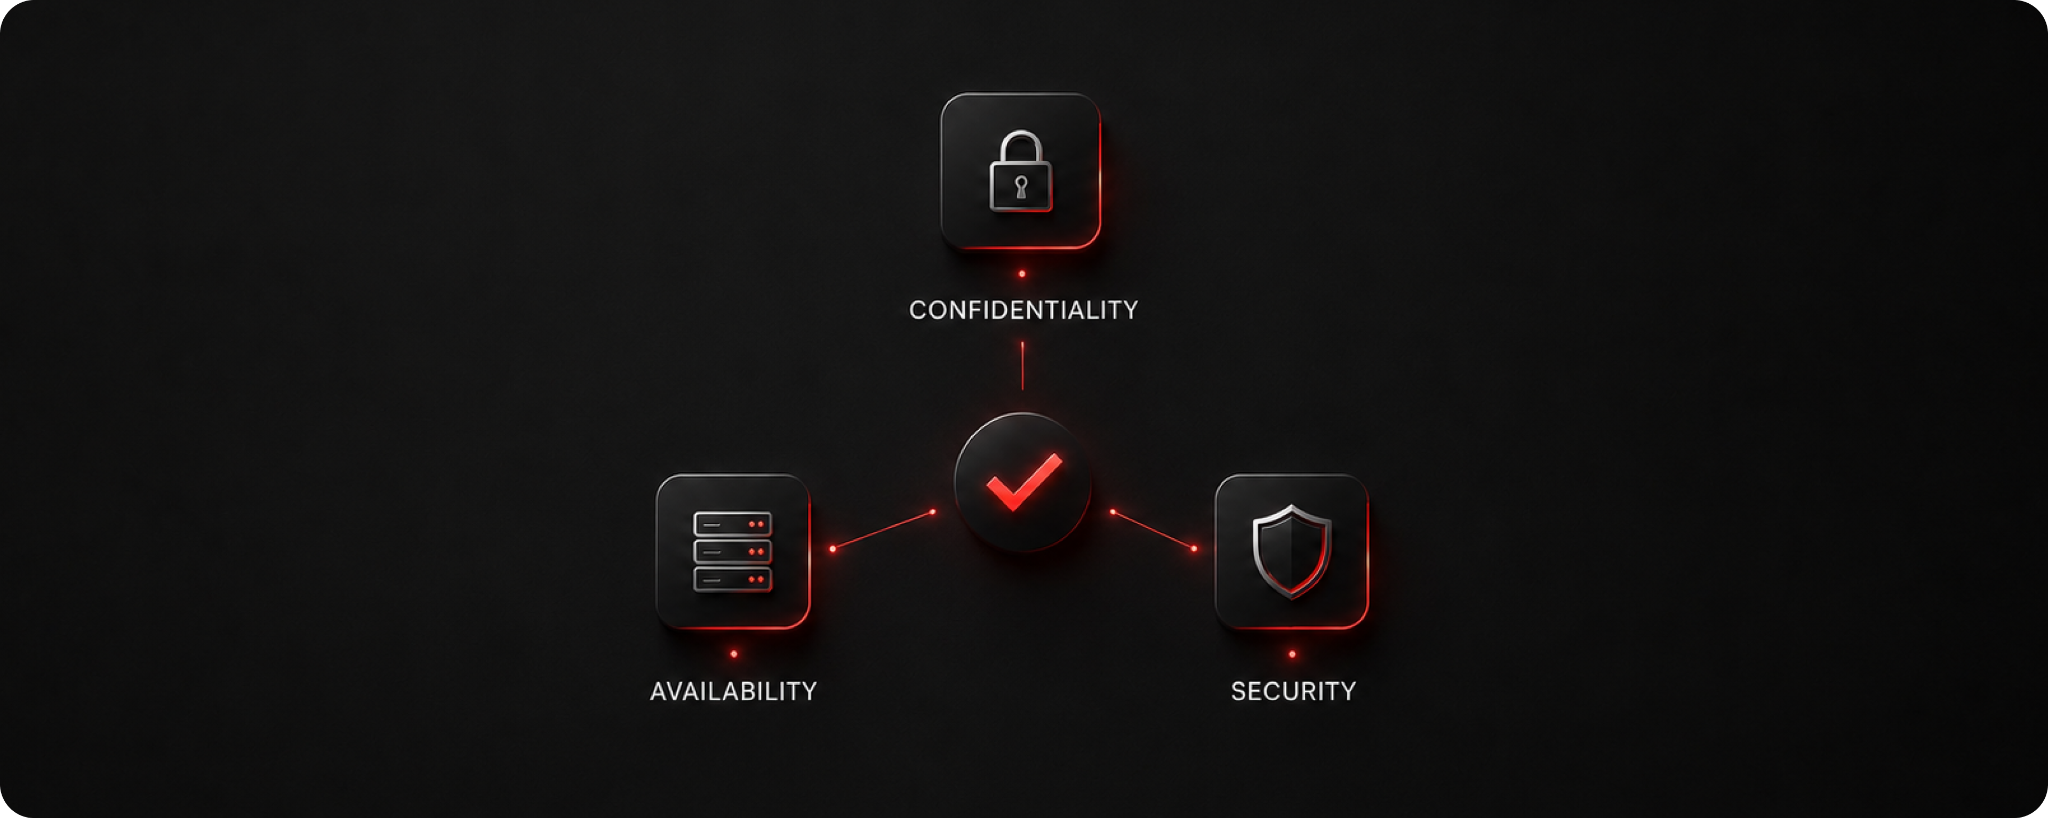
Our previous certification covered Security alone. This renewal adds Confidentiality and Availability, two criteria that enterprise and regulated-industry customers consistently ask about in procurement.
Security: Controls protect the Lamatic platform against unauthorized access, threats, and vulnerabilities. This includes role-based access control, MFA enforcement, annual penetration testing, and continuous automated vulnerability scanning.
Confidentiality: Customer data and information subject to confidentiality agreements are handled, stored, and disposed of in accordance with documented policies. Employees and contractors are bound by NDAs, and data access is governed by least-privilege principles reviewed quarterly.
Availability: The platform is monitored around the clock with real-time dashboards and alerting. Incident response procedures are documented and tested. Backups are encrypted at rest and maintained across redundant providers.
An independent auditor reviewed our controls and confirmed they operated effectively throughout the entire audit period, not just at a point in time.
You can view our real-time compliance posture at trust.lamatic.ai.
New Stack Vendors: Hardened for Performance and Security
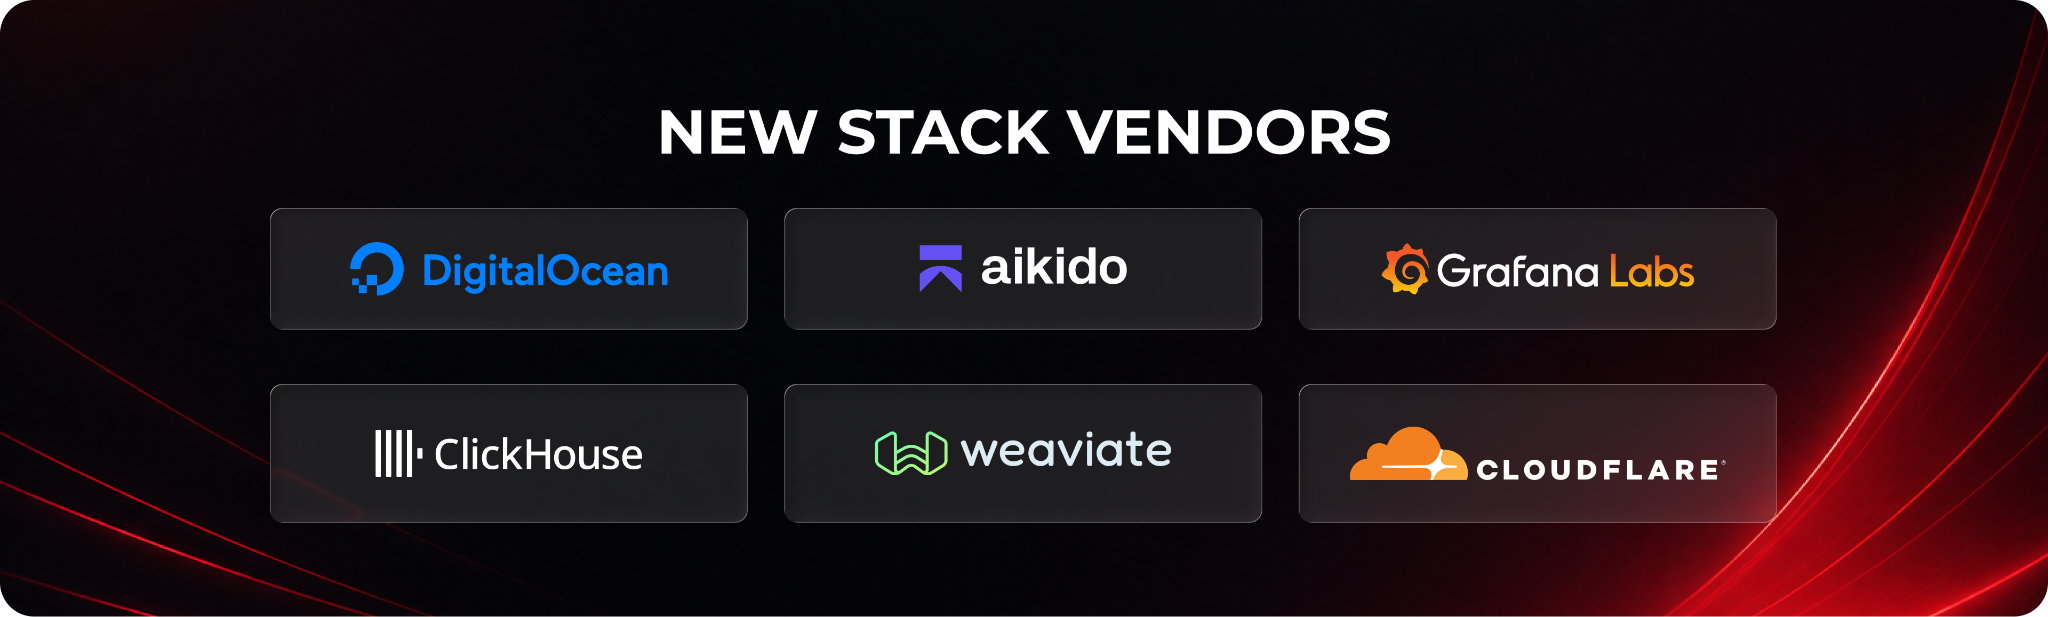
This renewal cycle coincided with meaningful upgrades to the Lamatic infrastructure stack. Several new vendors were brought in specifically to raise the performance and security bar, and all were fully in scope for the auditor's testing.
DigitalOcean (primary cloud): All production workloads and managed databases now run on DigitalOcean with tenant-isolated infrastructure as a core design principle, replacing GCP as the primary provider.
Aikido Security: Consolidated all security scanning into a single platform covering SAST, SCA, DAST, container scanning, IaC scanning, and developer device monitoring. Replaced separate Deepsource and Snyk tools.
Grafana: Centralized observability across all infrastructure components, aggregating metrics, logs, and traces with real-time dashboards and incident alerting.
ClickHouse: High-performance analytics database for platform data, replacing legacy infrastructure.
Weaviate: Vector database powering AI agent memory, fully in-scope for data security and availability controls.
Cloudflare WAF/CDN: Network-layer protection with DDoS mitigation across all production endpoints.
Controls were assessed against the live system with all new vendors in place, not a pre-change snapshot.
Our Security and Compliance Partners
Building a rigorous compliance program as a lean team requires the right partners. Here's who we worked with and what role each played:
Vanta: Compliance automation and continuous control monitoring. Vanta powers our ISMS, tracks evidence collection across all in-scope systems, and keeps our control posture current between audits. It's the operational backbone that makes ongoing compliance sustainable, not a once-a-year scramble. Our live trust page at trust.lamatic.ai is powered by Vanta and shows real-time control status to anyone who needs it.
Aikido Security: Our security testing platform. Beyond continuous scanning, Aikido monitors developer devices and flags vulnerabilities across our entire codebase and infrastructure in real time. It gave our auditors a live, verifiable evidence trail for security controls rather than point-in-time screenshots. You can request our Aikido security report directly at aikido.dev/audit-report/lamatic.
Prescient Assurance LLC: Our independent SOC 2 auditor, based in Nashville, TN. Prescient conducted the Type 2 examination in accordance with AICPA attestation standards, reviewing both the design and operating effectiveness of our controls over the full audit period.
How We Used AI Agents to Run a More Rigorous Audit
As a platform built for AI agents, we practiced what we preach. This audit cycle was the first time we systematically used agents to accelerate and strengthen the internal audit process.
We deployed agents to cross-reference our SOC 2 system description against live Notion policy documents, flagging inconsistencies between attested controls and actual configurations before the auditor ever saw them. Agents reviewed the testing matrix for internally contradictory findings, tracked the status of every open non-conformity across our compliance database, and maintained real-time updates to our Internal Audit Report, Statement of Applicability, and System Description as the audit progressed.
The result: Our internal audit team caught and resolved gaps that would typically surface only during fieldwork, reducing back-and-forth with Prescient Assurance and compressing the overall audit timeline. This is the same capability we're building into the Lamatic platform for our customers.
Ready to Evaluate Lamatic
If you're evaluating Lamatic for an enterprise or regulated environment, here's how to access our security documentation:
Real-time compliance status: trust.lamatic.ai shows our live control posture, updated continuously.
Aikido security report: Request our automated security scan report at aikido.dev/audit-report/lamatic. No NDA required.
SOC 2 Type 2 report: The full Prescient Assurance report (testing matrix, subservice org disclosures, management assertion) is available under NDA. Reach out at hello@lamatic.ai or contact your account team directly.
Lamatic.ai is a product of Dinner Technologies, Inc. Prescient Assurance LLC conducted the SOC 2 Type 2 examination in accordance with the AICPA's attestation standards.
August 6th, 2026
Improved

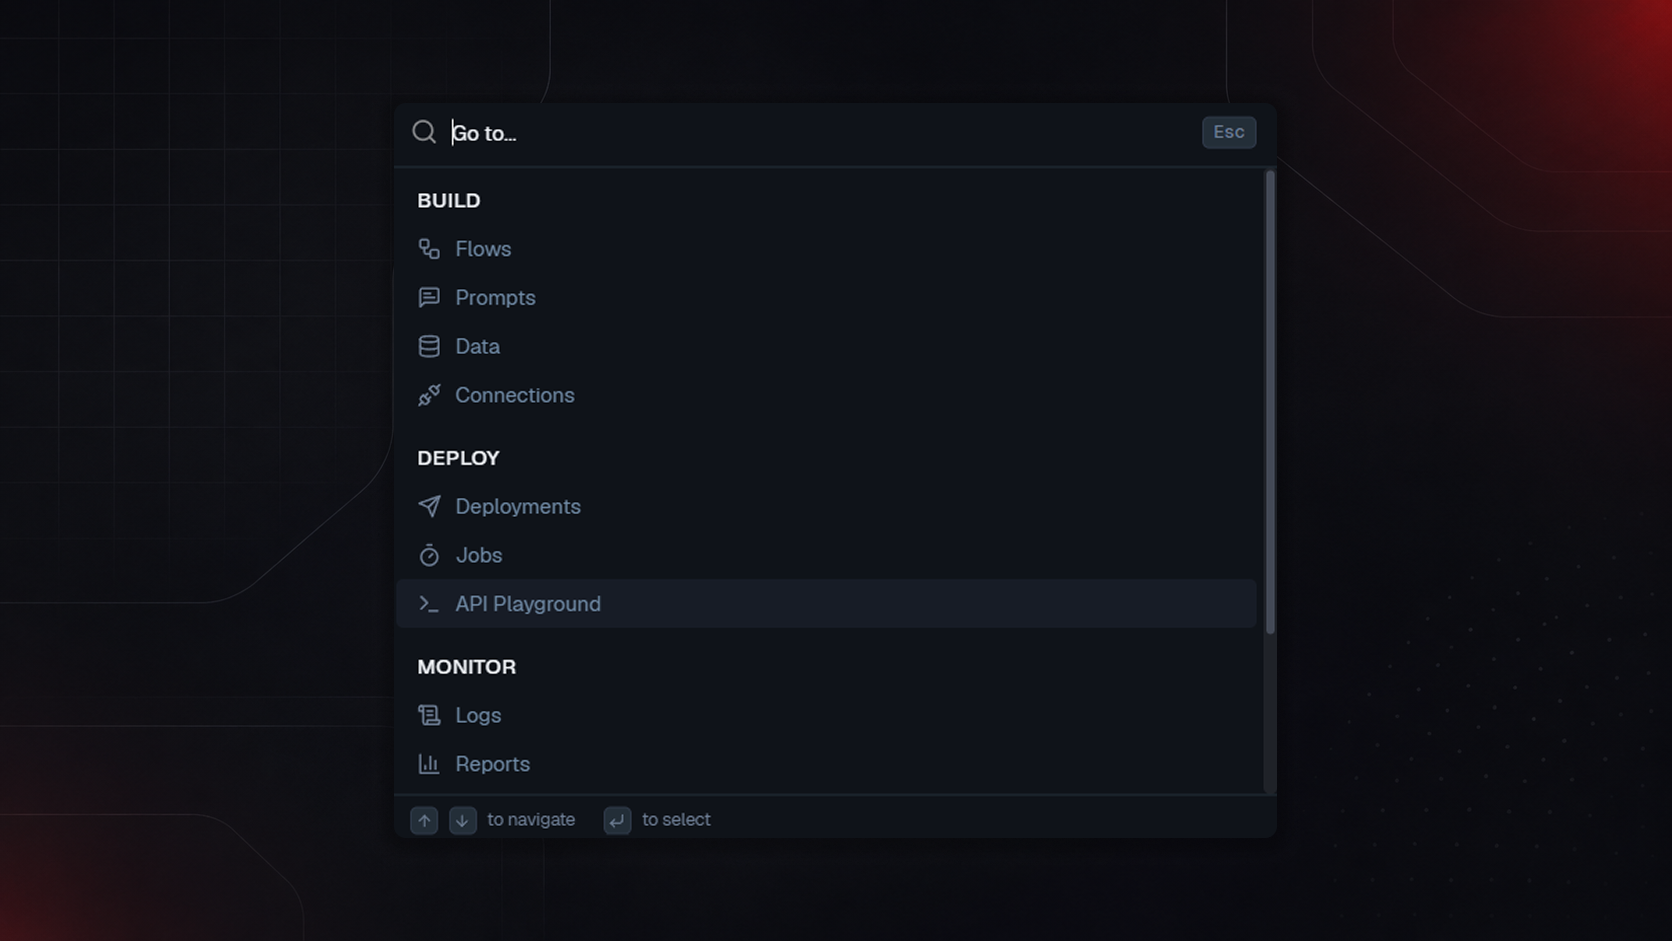
Global Search
Press the search shortcut (Ctrl/Cmd + K) or click the search icon anywhere in the app and jump straight to any section: Flows, Prompts, Data, Connections, Deployments, Jobs, API Playground, Logs, Reports grouped under Build, Deploy, and Monitor.
Type to filter, use arrow keys to navigate, hit Enter to go. No more hunting through the sidebar for something you know exists but can't remember where you tucked it.
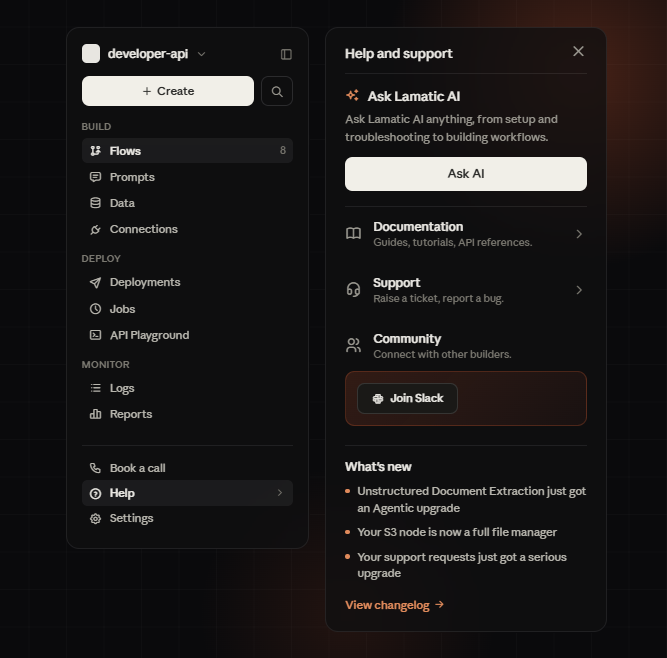
Sidebar improvements
The sidebar's been reorganized around how you actually work: Build, Deploy, and Monitor as clear sections instead of one long flat list. We've also added quick access at the bottom for:
Book a Call to talk to the team directly
Help get support without leaving the app
Settings are now easier to reach
August 5th, 2026
Improved

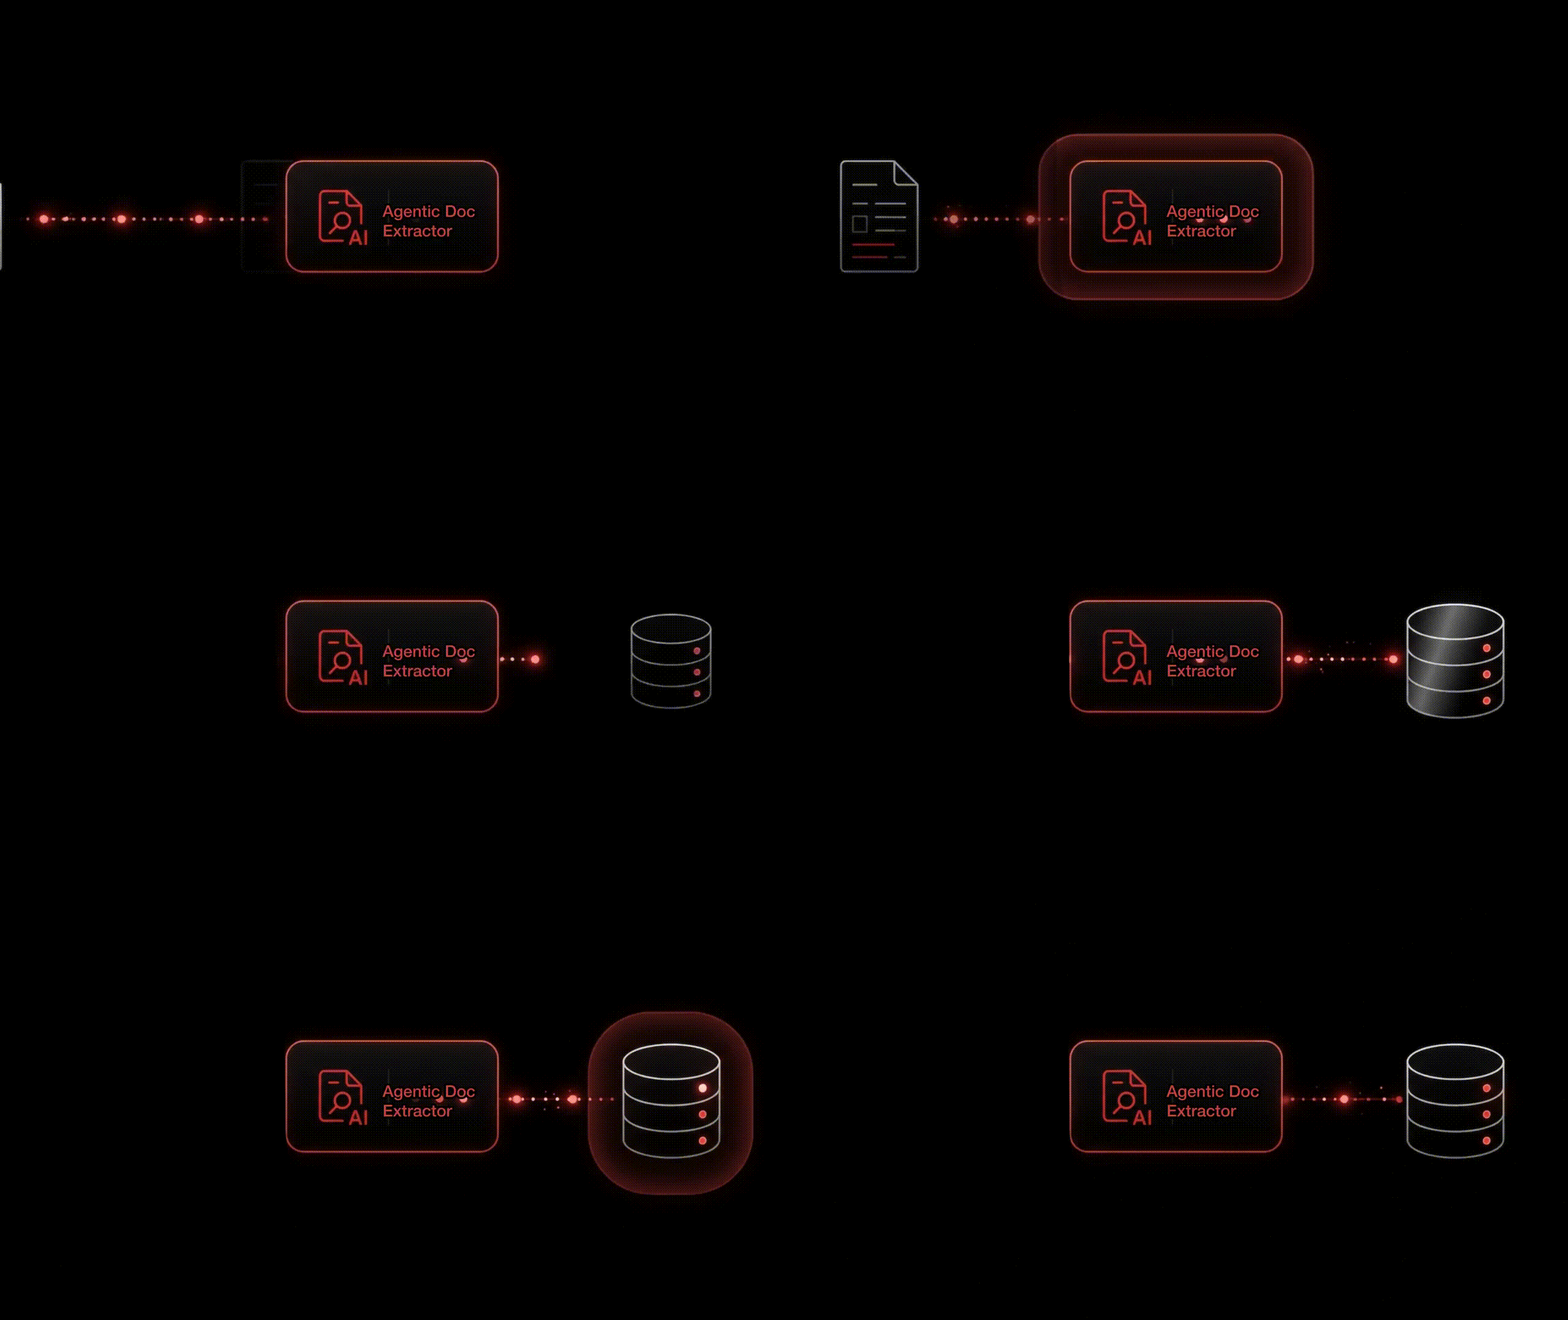
A PDF lands in your flow, and getting anything usable out of it means three separate steps: OCR it, parse the result into something structured, then figure out where to put the images so they don't just vanish as base64 blobs.
The new Agentic Doc Extraction node does all three in one place. Give it a document, tell it what you want back, and you get clean Markdown, structured JSON, and every image, stored and ready to use, from a single step.
What you actually get back
Markdown, page by page or joined into one document ready to drop into a RAG pipeline as-is.
Structured JSON, shaped to a schema you write yourself. No prompt tuning; you describe what a field means once, and the model finds it on every document you run through.
Every image in the document, automatically stored with a signed URL you can use right away and a durable key for later. No more inline base64 bloating your flow's output.
Bounding boxes and per-image annotations, if you want the model to read a chart or figure the same way it reads a page.
How it works
Drop the node into a flow, point it at a document URL, and pick your OCR provider: Mistral's public API, or your own private Azure AI Foundry endpoint if that's where your data needs to stay.
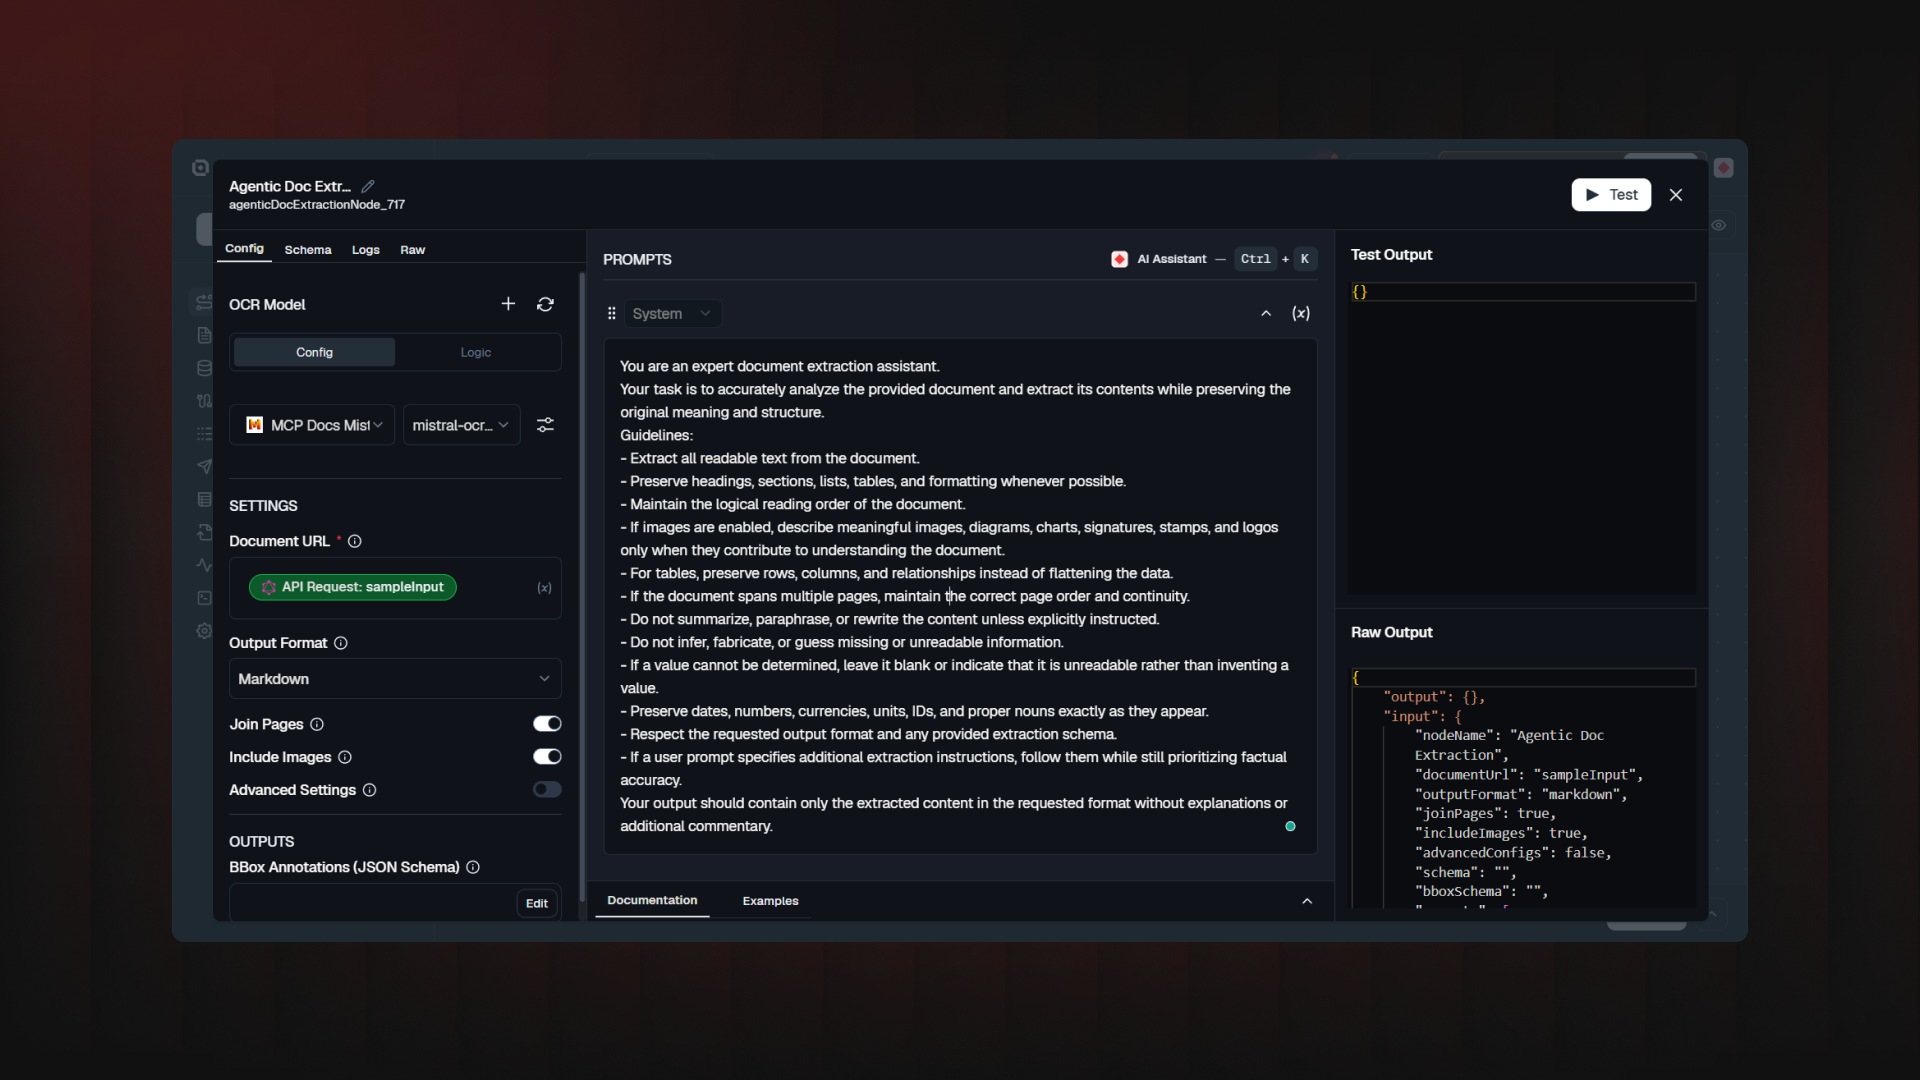
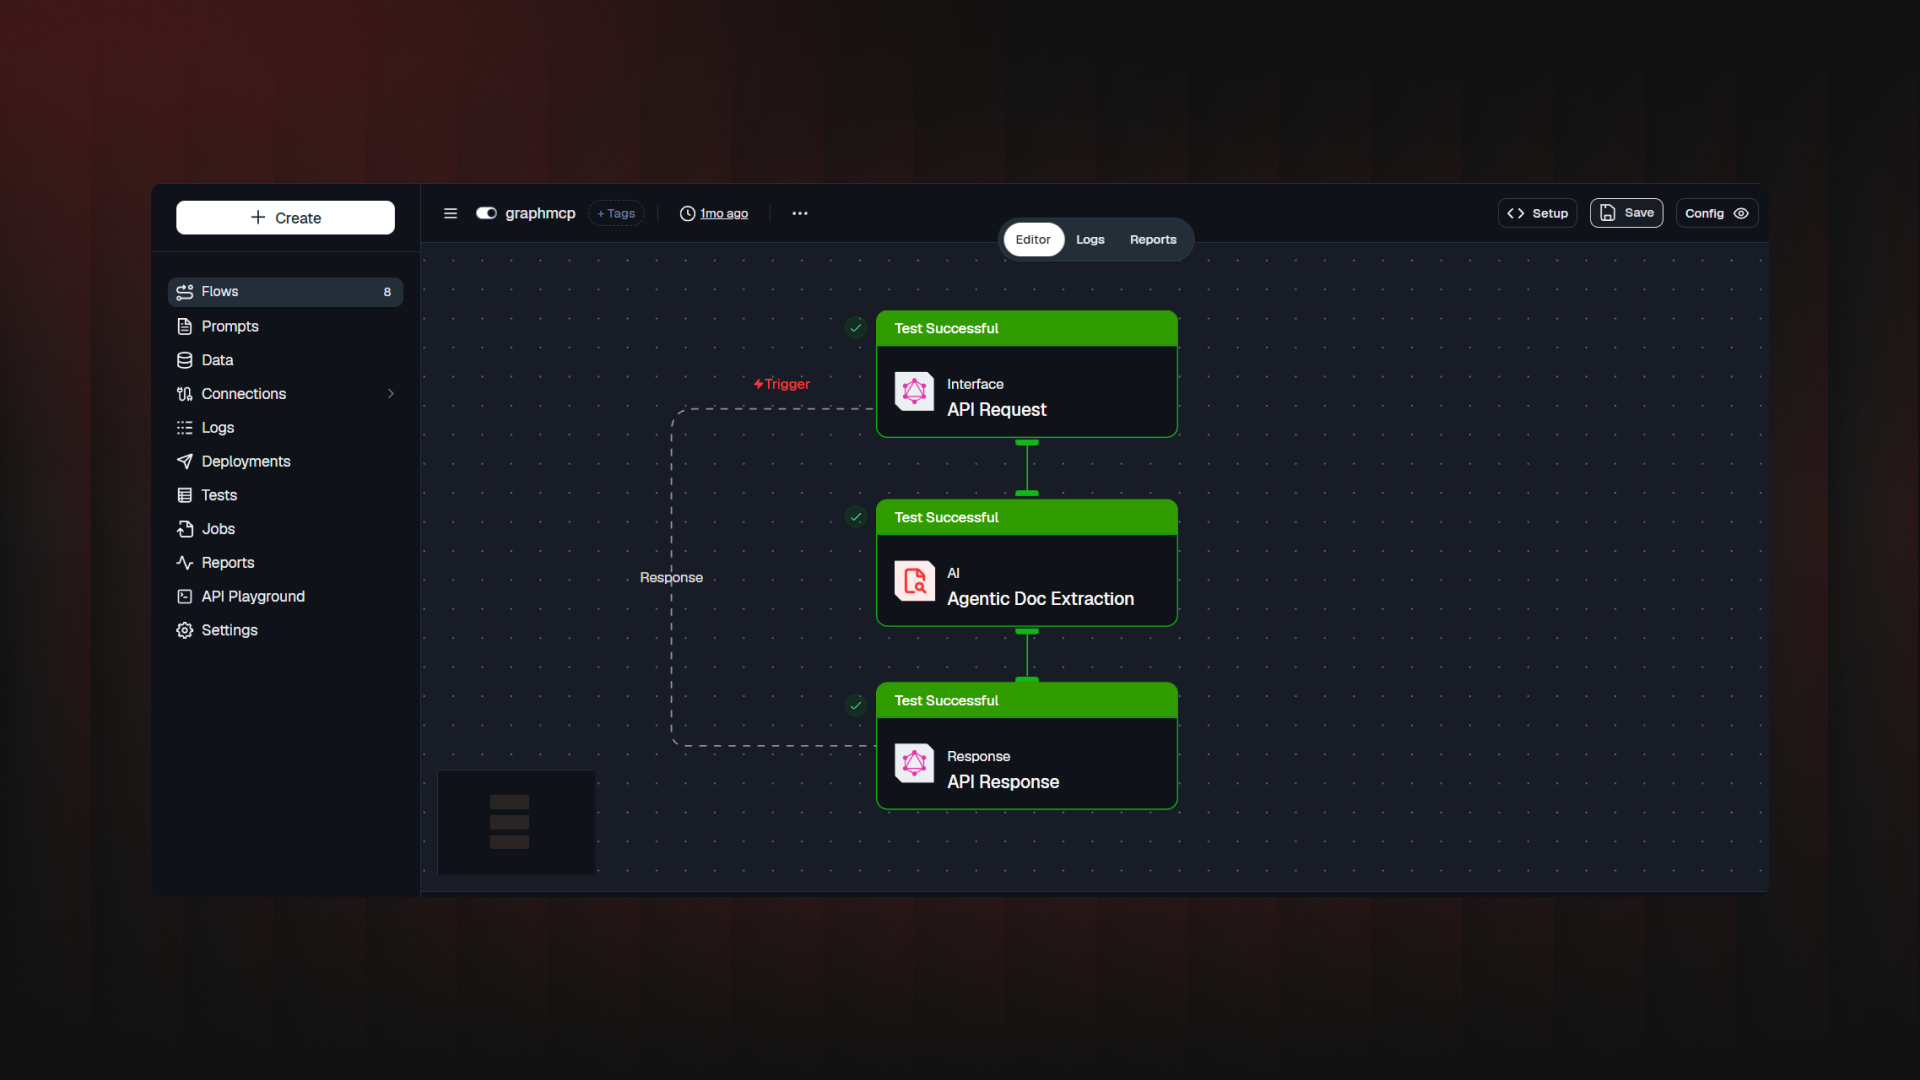
Under the hood, each run gets its own isolated container. It splits the document into pages, OCRs them in parallel, and stores any images it finds.
The part that actually matters is the Output Schema. You're not writing a prompt and hoping you're describing each field in plain language, and the model reads the document specifically for that field. Change the description, change what comes back. No trial and error.
If you're coming from Doc Extractor
Doc Extractor is retired, but nothing you've already built breaks. If you're moving a flow over, three things behave differently and are worth knowing before you switch:
Gemini isn't supported here. Only Mistral and Azure AI Foundry. If you were on Gemini, you'll need to pick a different provider.
extractedTextis now a list of pages, not one long string.structuredDatais now a list too, one entry per page, instead of a single object.
The docs have a full field-by-field mapping if you want to check before you touch a production flow.
July 24th, 2026
Improved
Integrations
Until now, the S3 node did one thing: watch a bucket and feed new files into a RAG flow. Useful, but limited: if you wanted to actually do something with a file, you were stuck writing custom code or bolting on another tool.
Not anymore. The S3 node now works in two modes, picked per node.
How it works
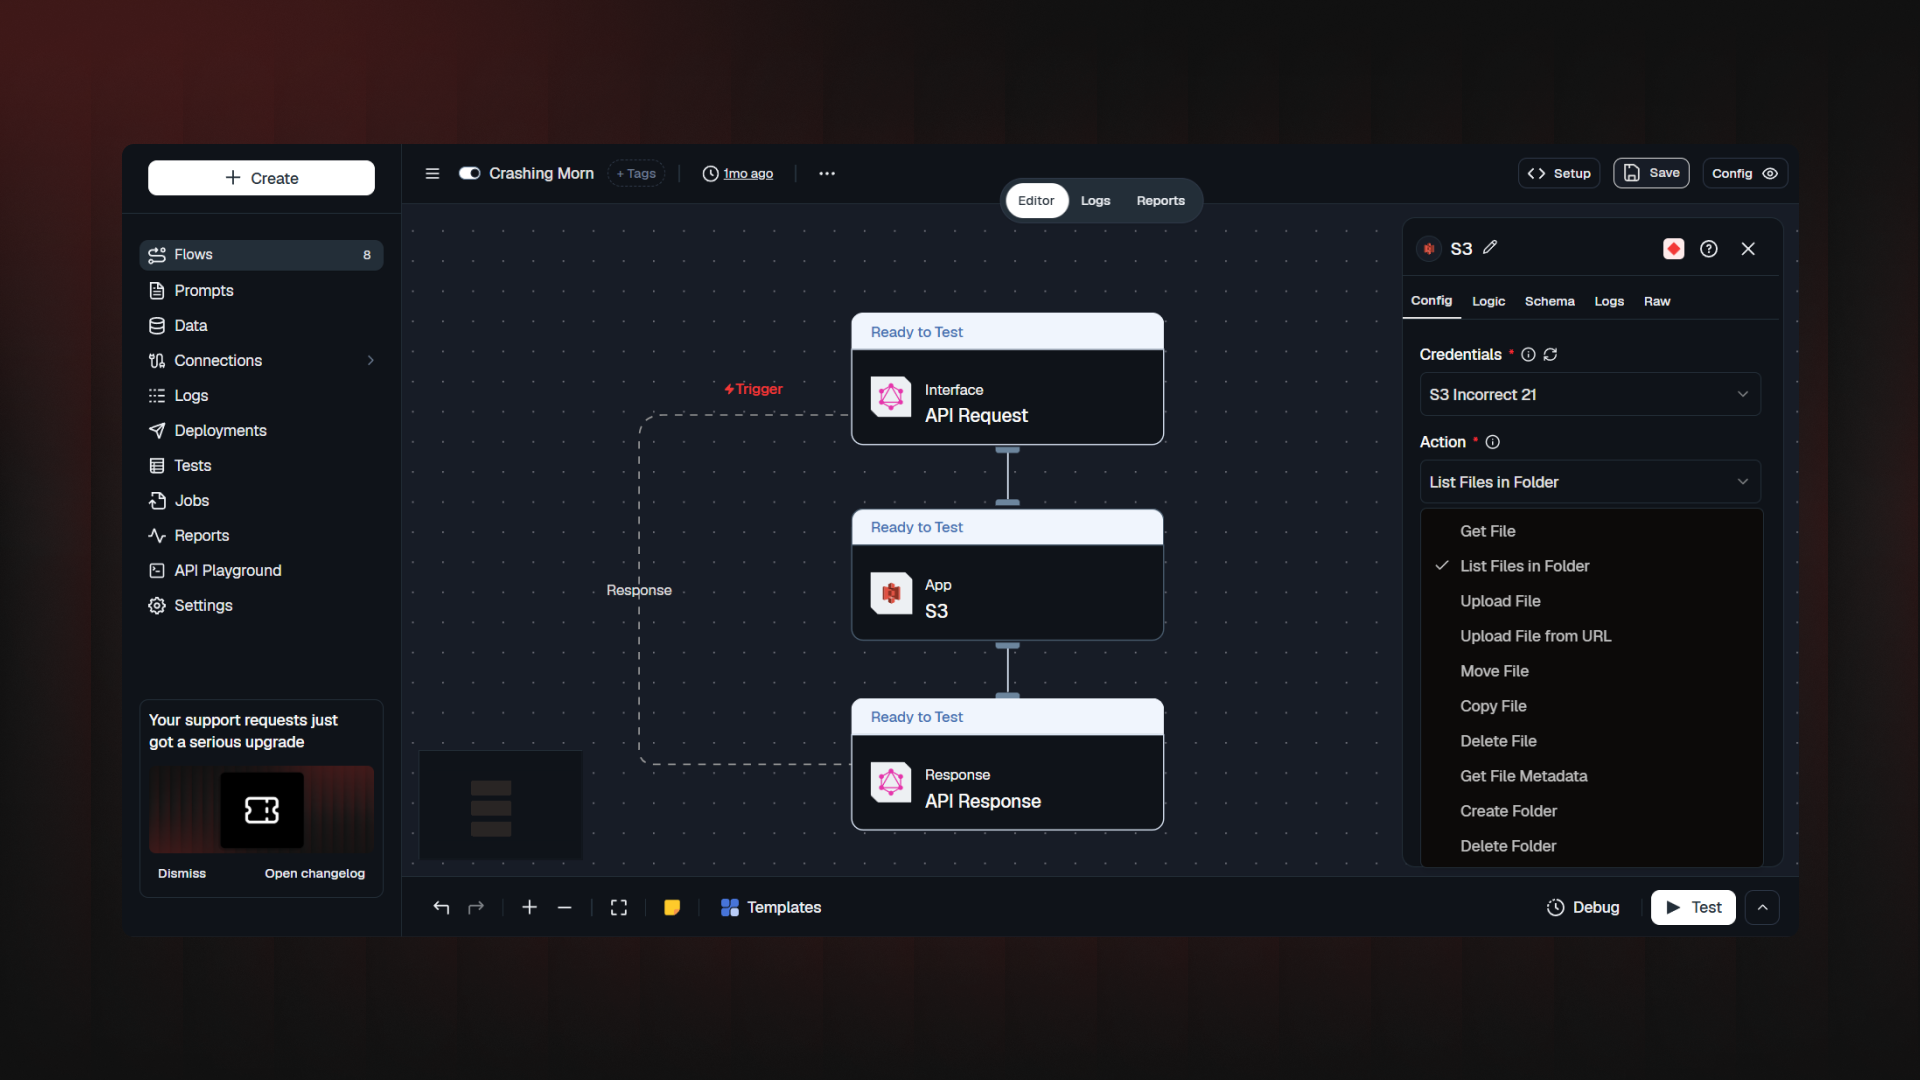
Trigger mode is the S3 node you already know: it watches a bucket on a schedule and syncs files into a flow for RAG. Unchanged, your existing flows keep working exactly as they did.
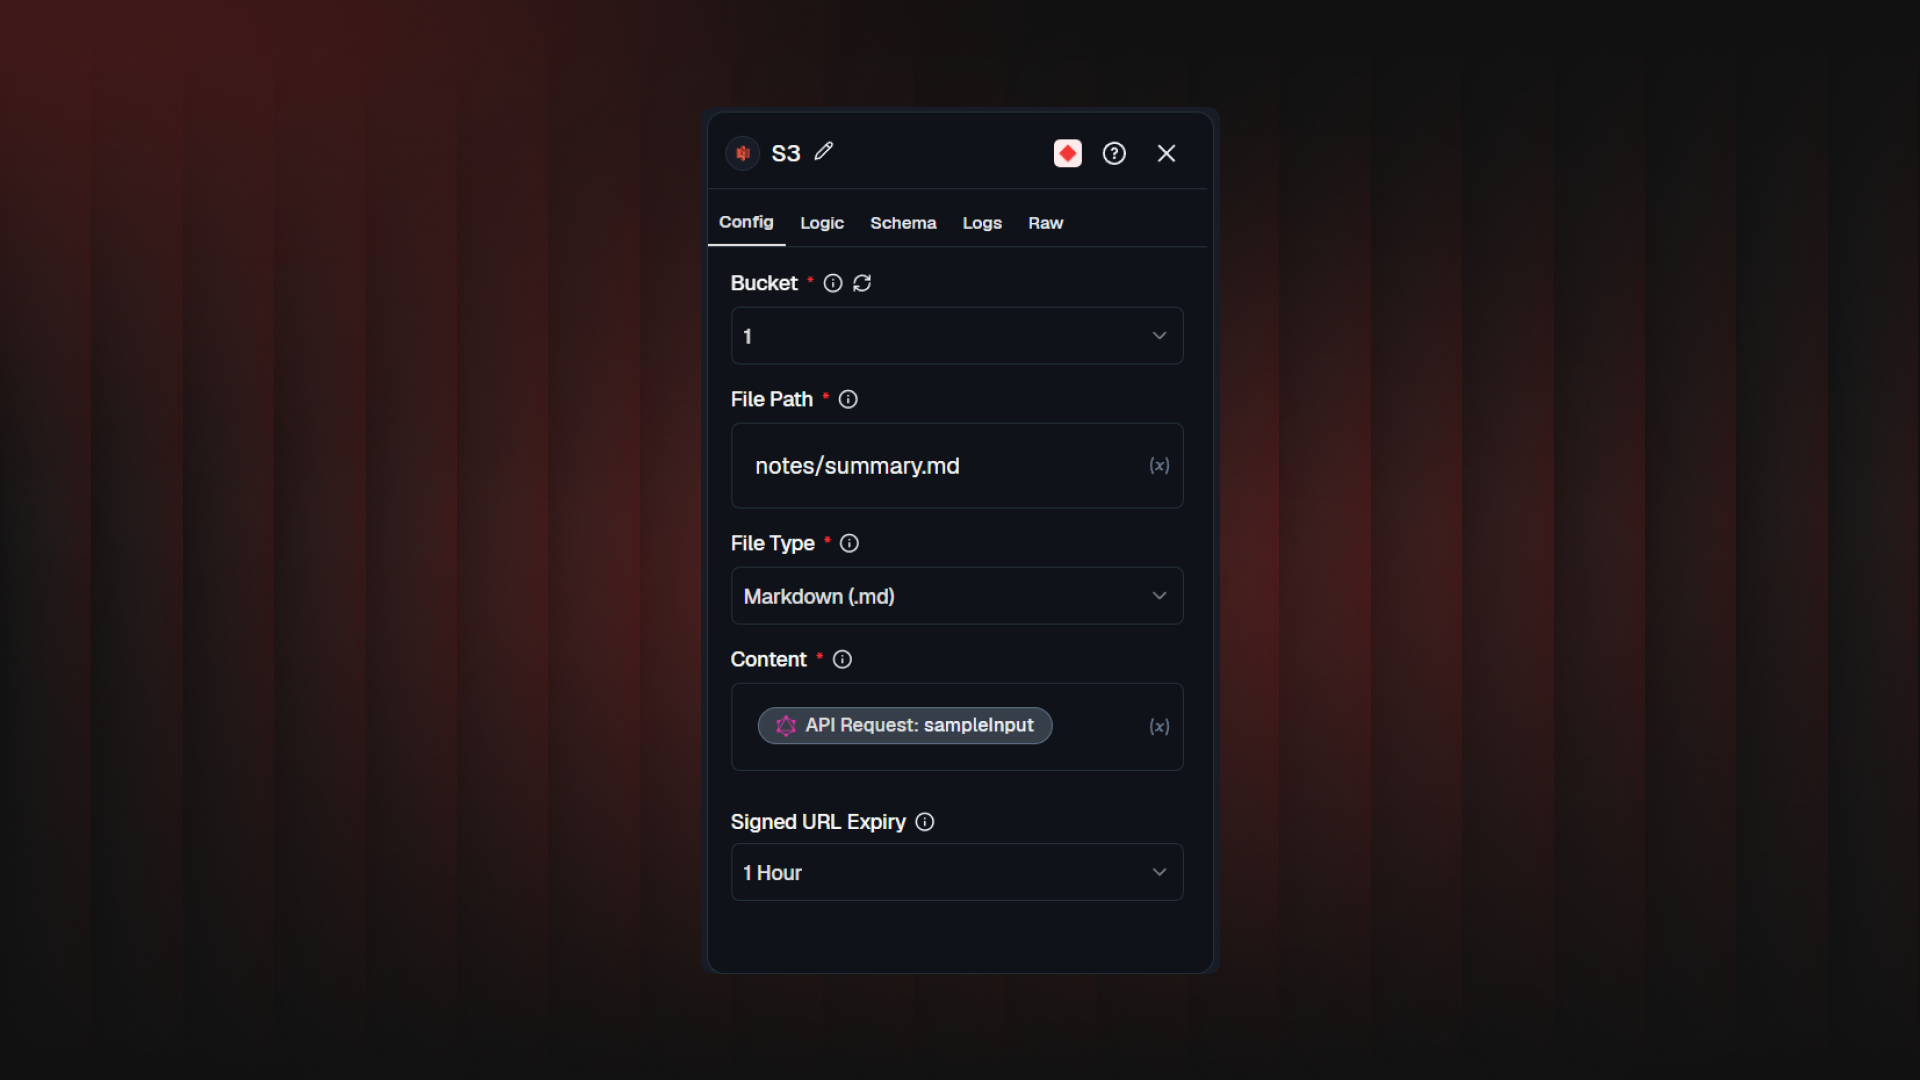
Action mode is brand new. Drop an S3 node anywhere in a flow and pick an operation from the Action dropdown: upload, fetch, list, move, copy, delete, check existence, read metadata, or manage folders. Ten operations, each showing only the fields it needs.
Upload File: write text, Markdown, JSON, CSV, or HTML into the bucket, straight from the flow. JSON gets validated before anything is written.
Upload File from URL: hands off a download to the bucket. Locked down since the URL is flow-controlled: only
http/https, no private/internal addresses, capped at 100 MB / 120 seconds.Get File / List Files in Folder: grab a signed URL for one file, or browse a folder with glob filtering.
Move / Copy File: relocate or duplicate files, even across buckets, with checks against overwriting a file with itself.
Delete File / Delete Folder / Create Folder / Get File Metadata: the rest of the toolkit.
Every action returning a URL lets you set Signed URL Expiry from 15 minutes to 7 days.
Also new: any S3-compatible provider, and clearer permissions
Point the new Endpoint field at Supabase Storage, MinIO, Cloudflare R2, or anything else speaking the S3 API; leave it empty, and it's AWS, as before. An AWS Region field was added too, used to sign requests correctly.
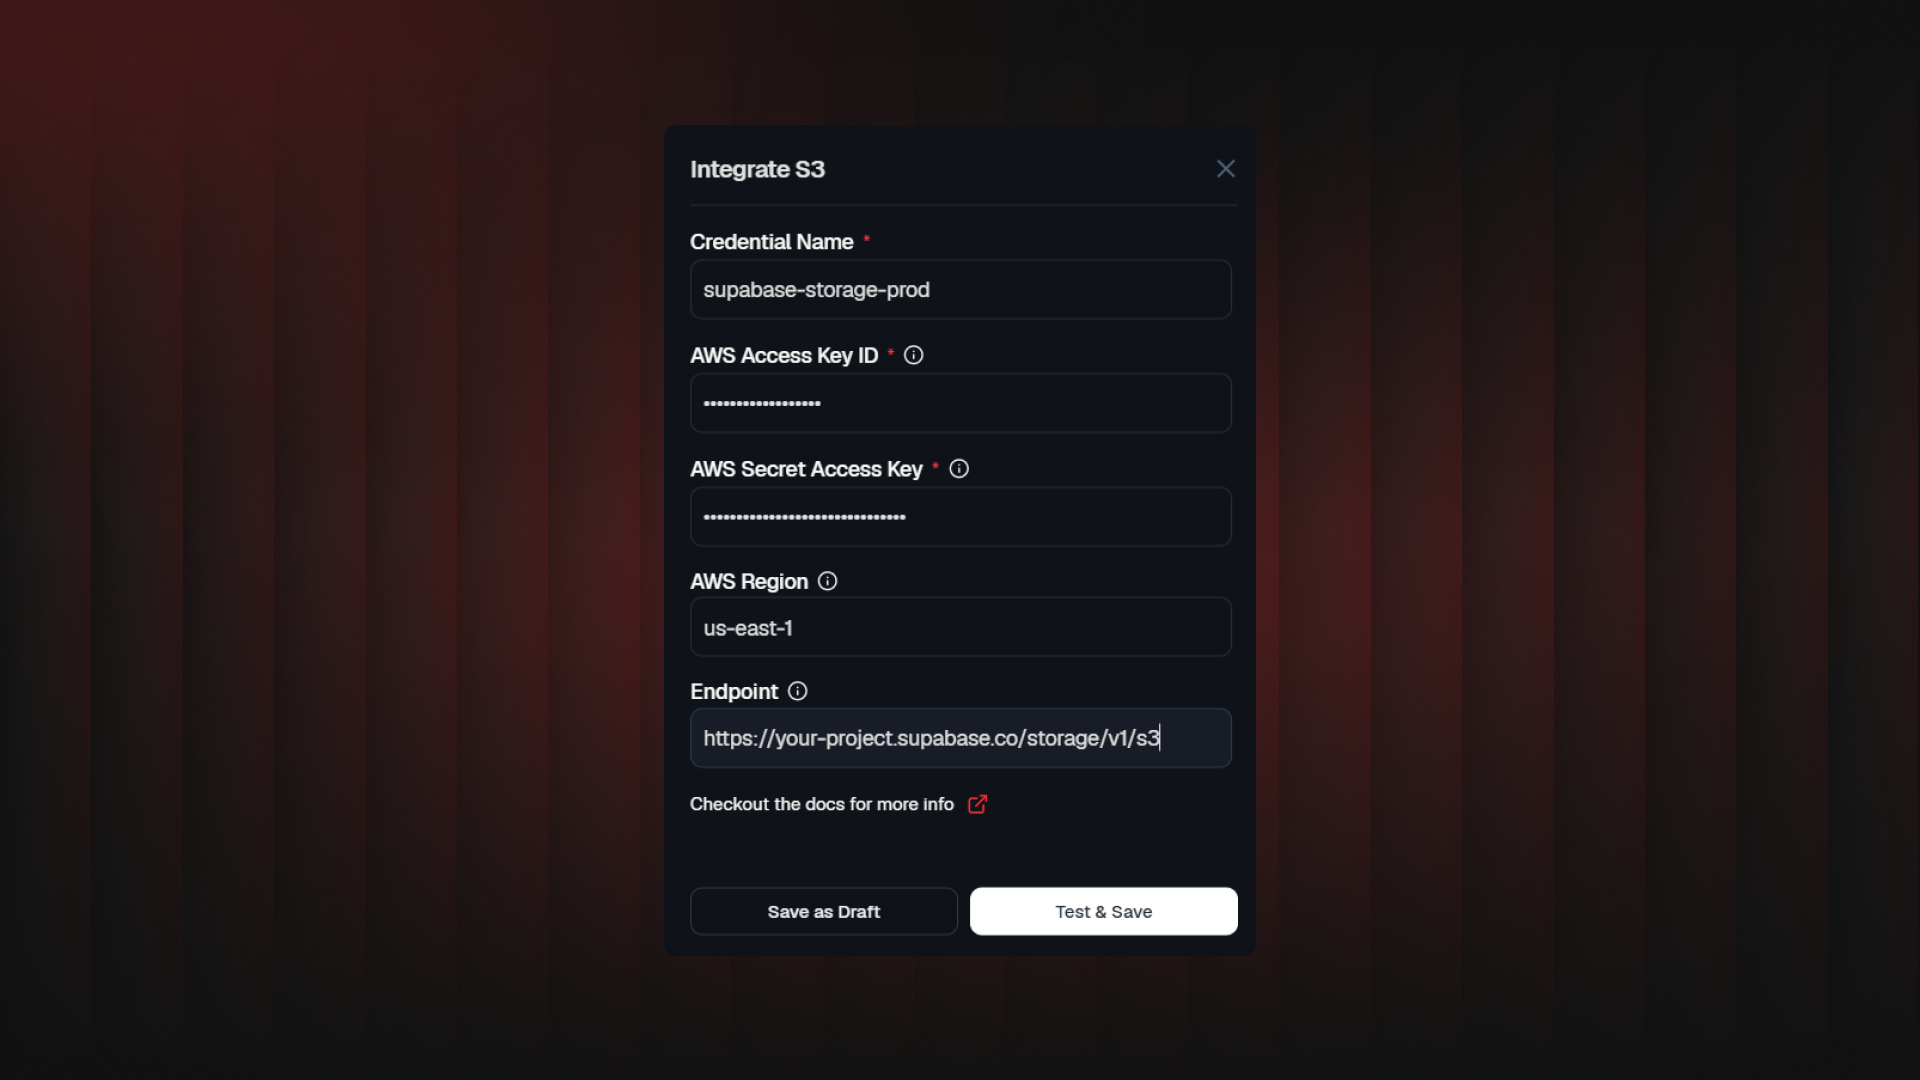
On the permissions side: Trigger mode still only needs read access. Action mode needs s3:PutObject (upload, copy, create folder) and s3:DeleteObject (delete, move) added to your IAM policy; we've documented a combined example so you're not guessing at the JSON.
One more small fix: Trigger mode's document_url used to be an s3:// path. It's now a signed HTTPS URL, valid for 5 hours, ready to use directly.
July 16th, 2026
Improved

Nobody likes repeating themselves to support. You paste the same error twice, explain the context again and wait for someone to ask a follow-up that you already answered in your first message.
We rebuilt support from the ground up so that doesn't happen anymore.
When you click "Get Support" in Studio, our bot Lima starts by understanding what kind of issue you're facing, not just taking your message and hoping for the best. That context travels with your request the entire way. If a human needs to step in, they already know what broke, where it broke, and what you tried. Less back and forth. Faster resolution.
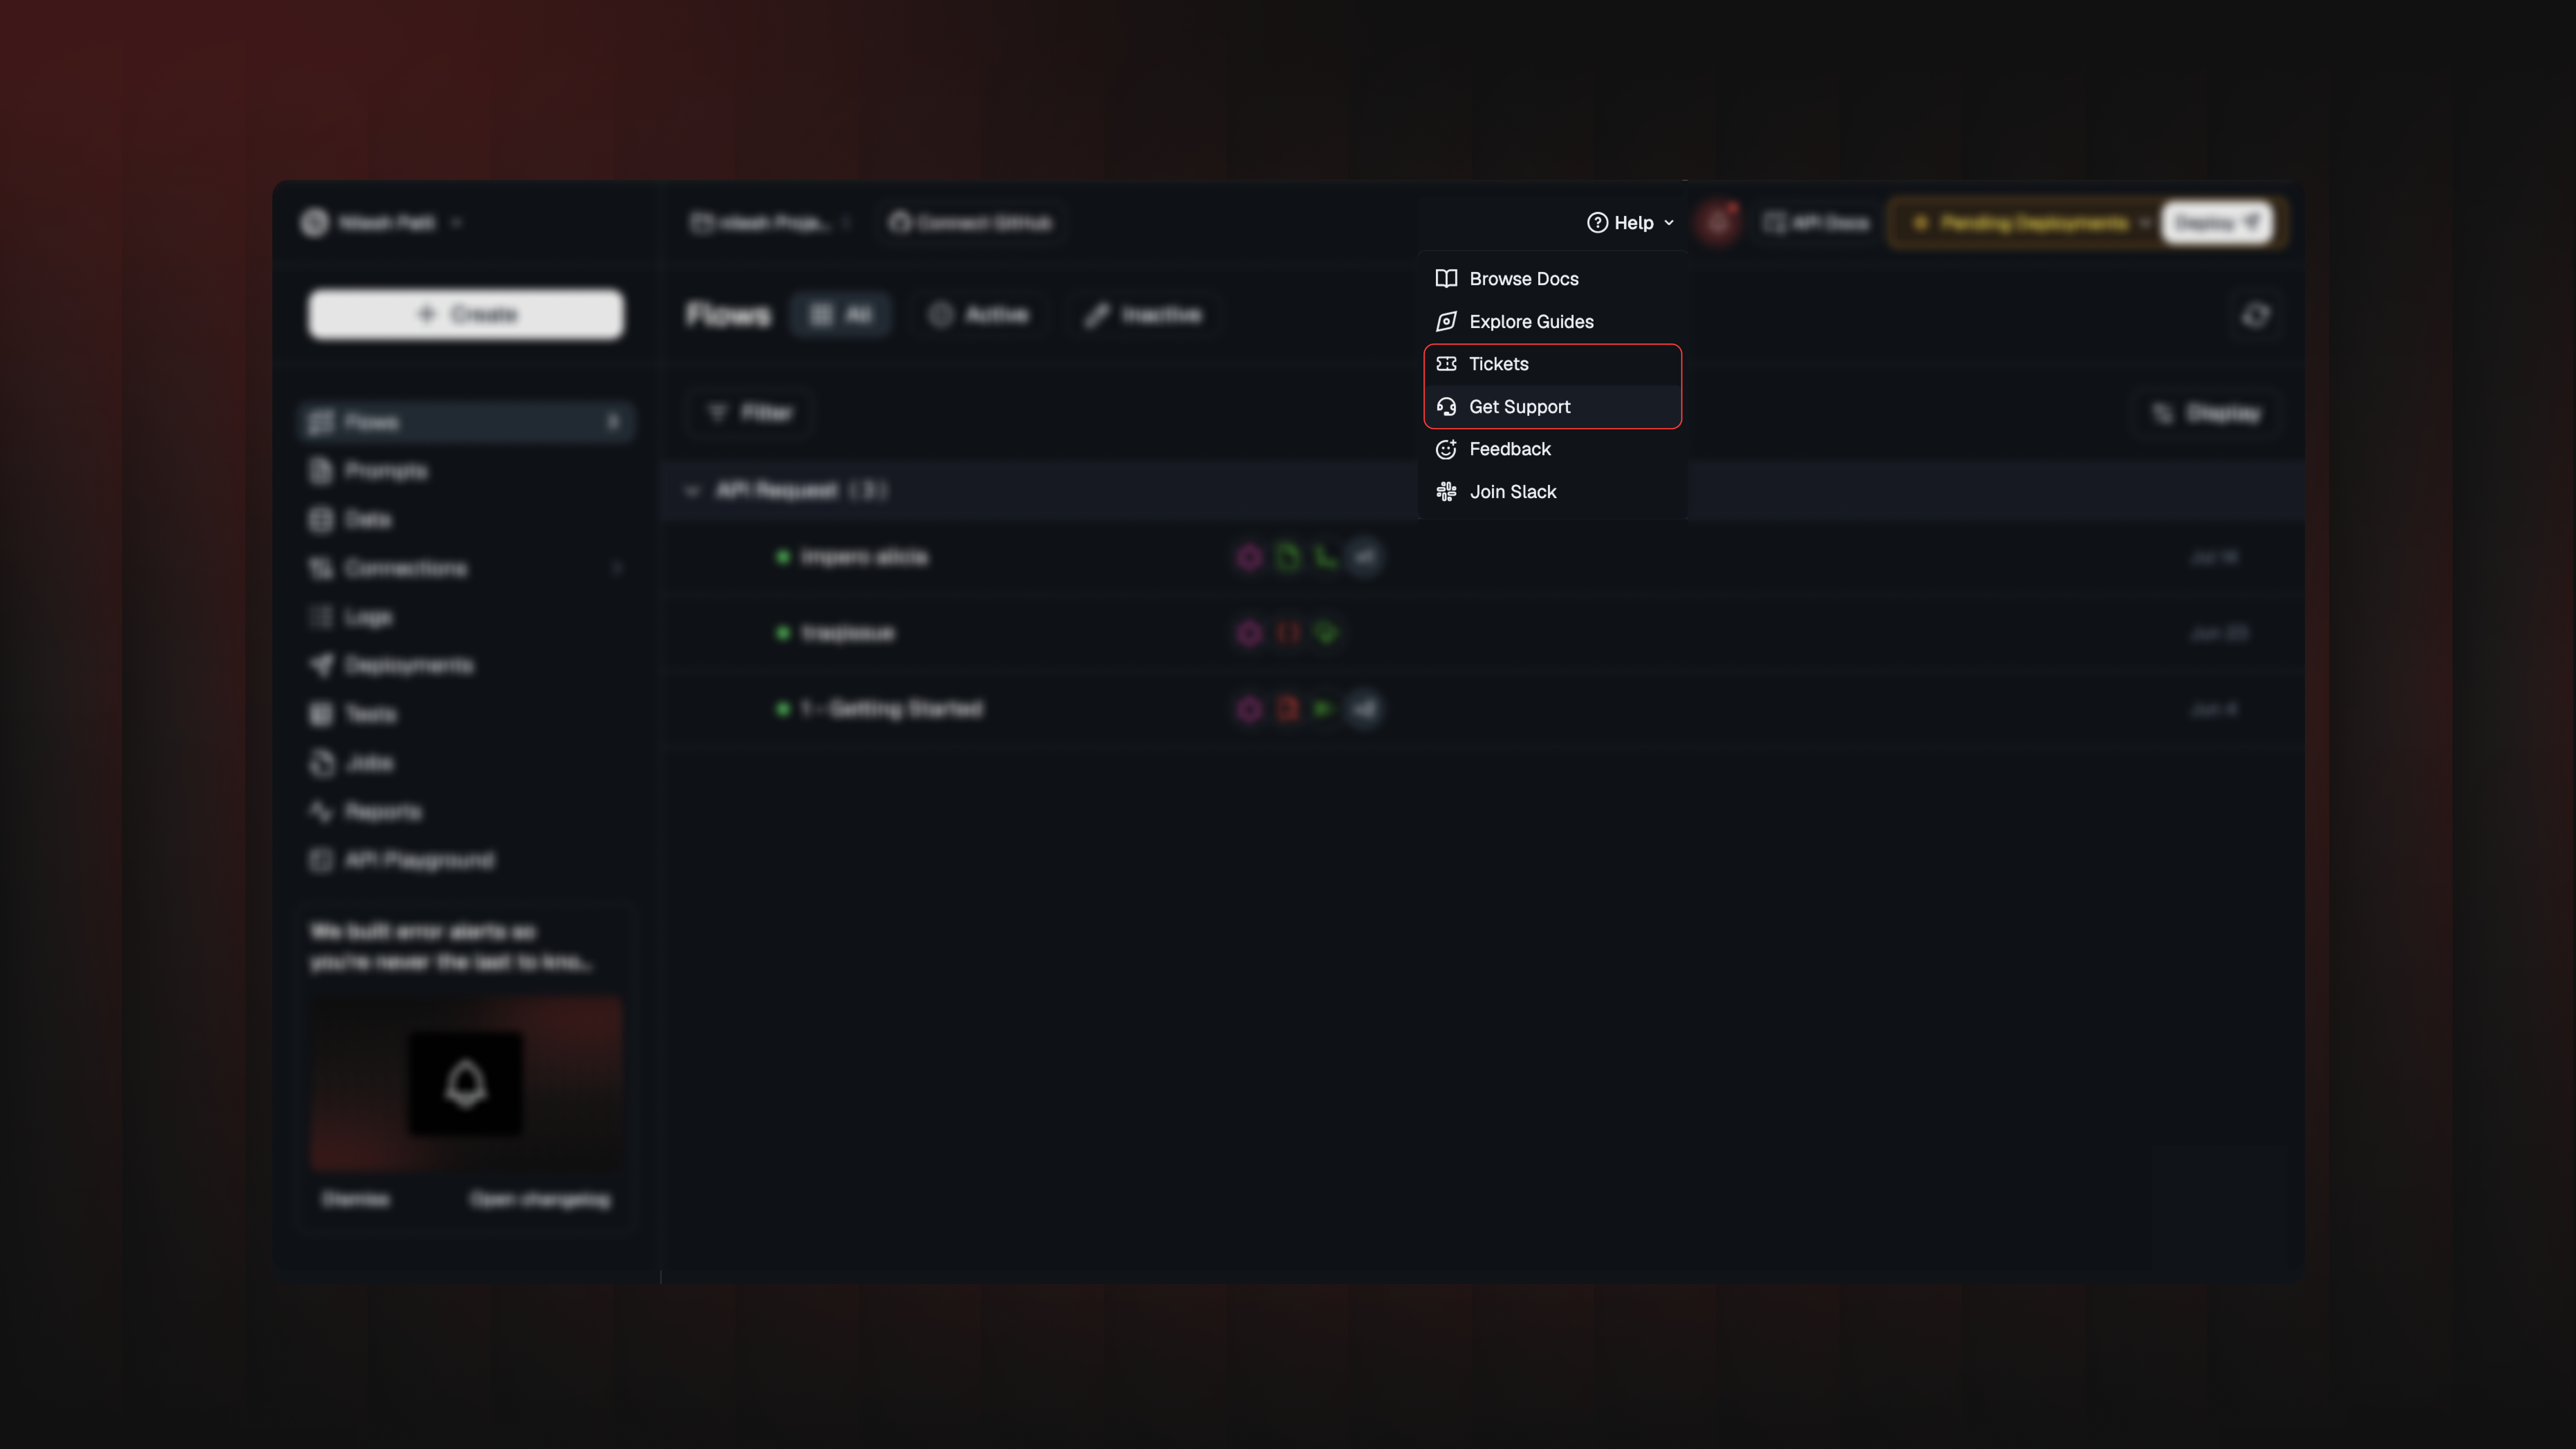
Tickets Centre
For Pro and Enterprise customers, issues that need investigation no longer disappear into a chat thread. They become tickets.
You submit the details once through a guided form. From there, you can see who's working on it, where it stands, and every update as it happens, without chasing anyone on Slack.
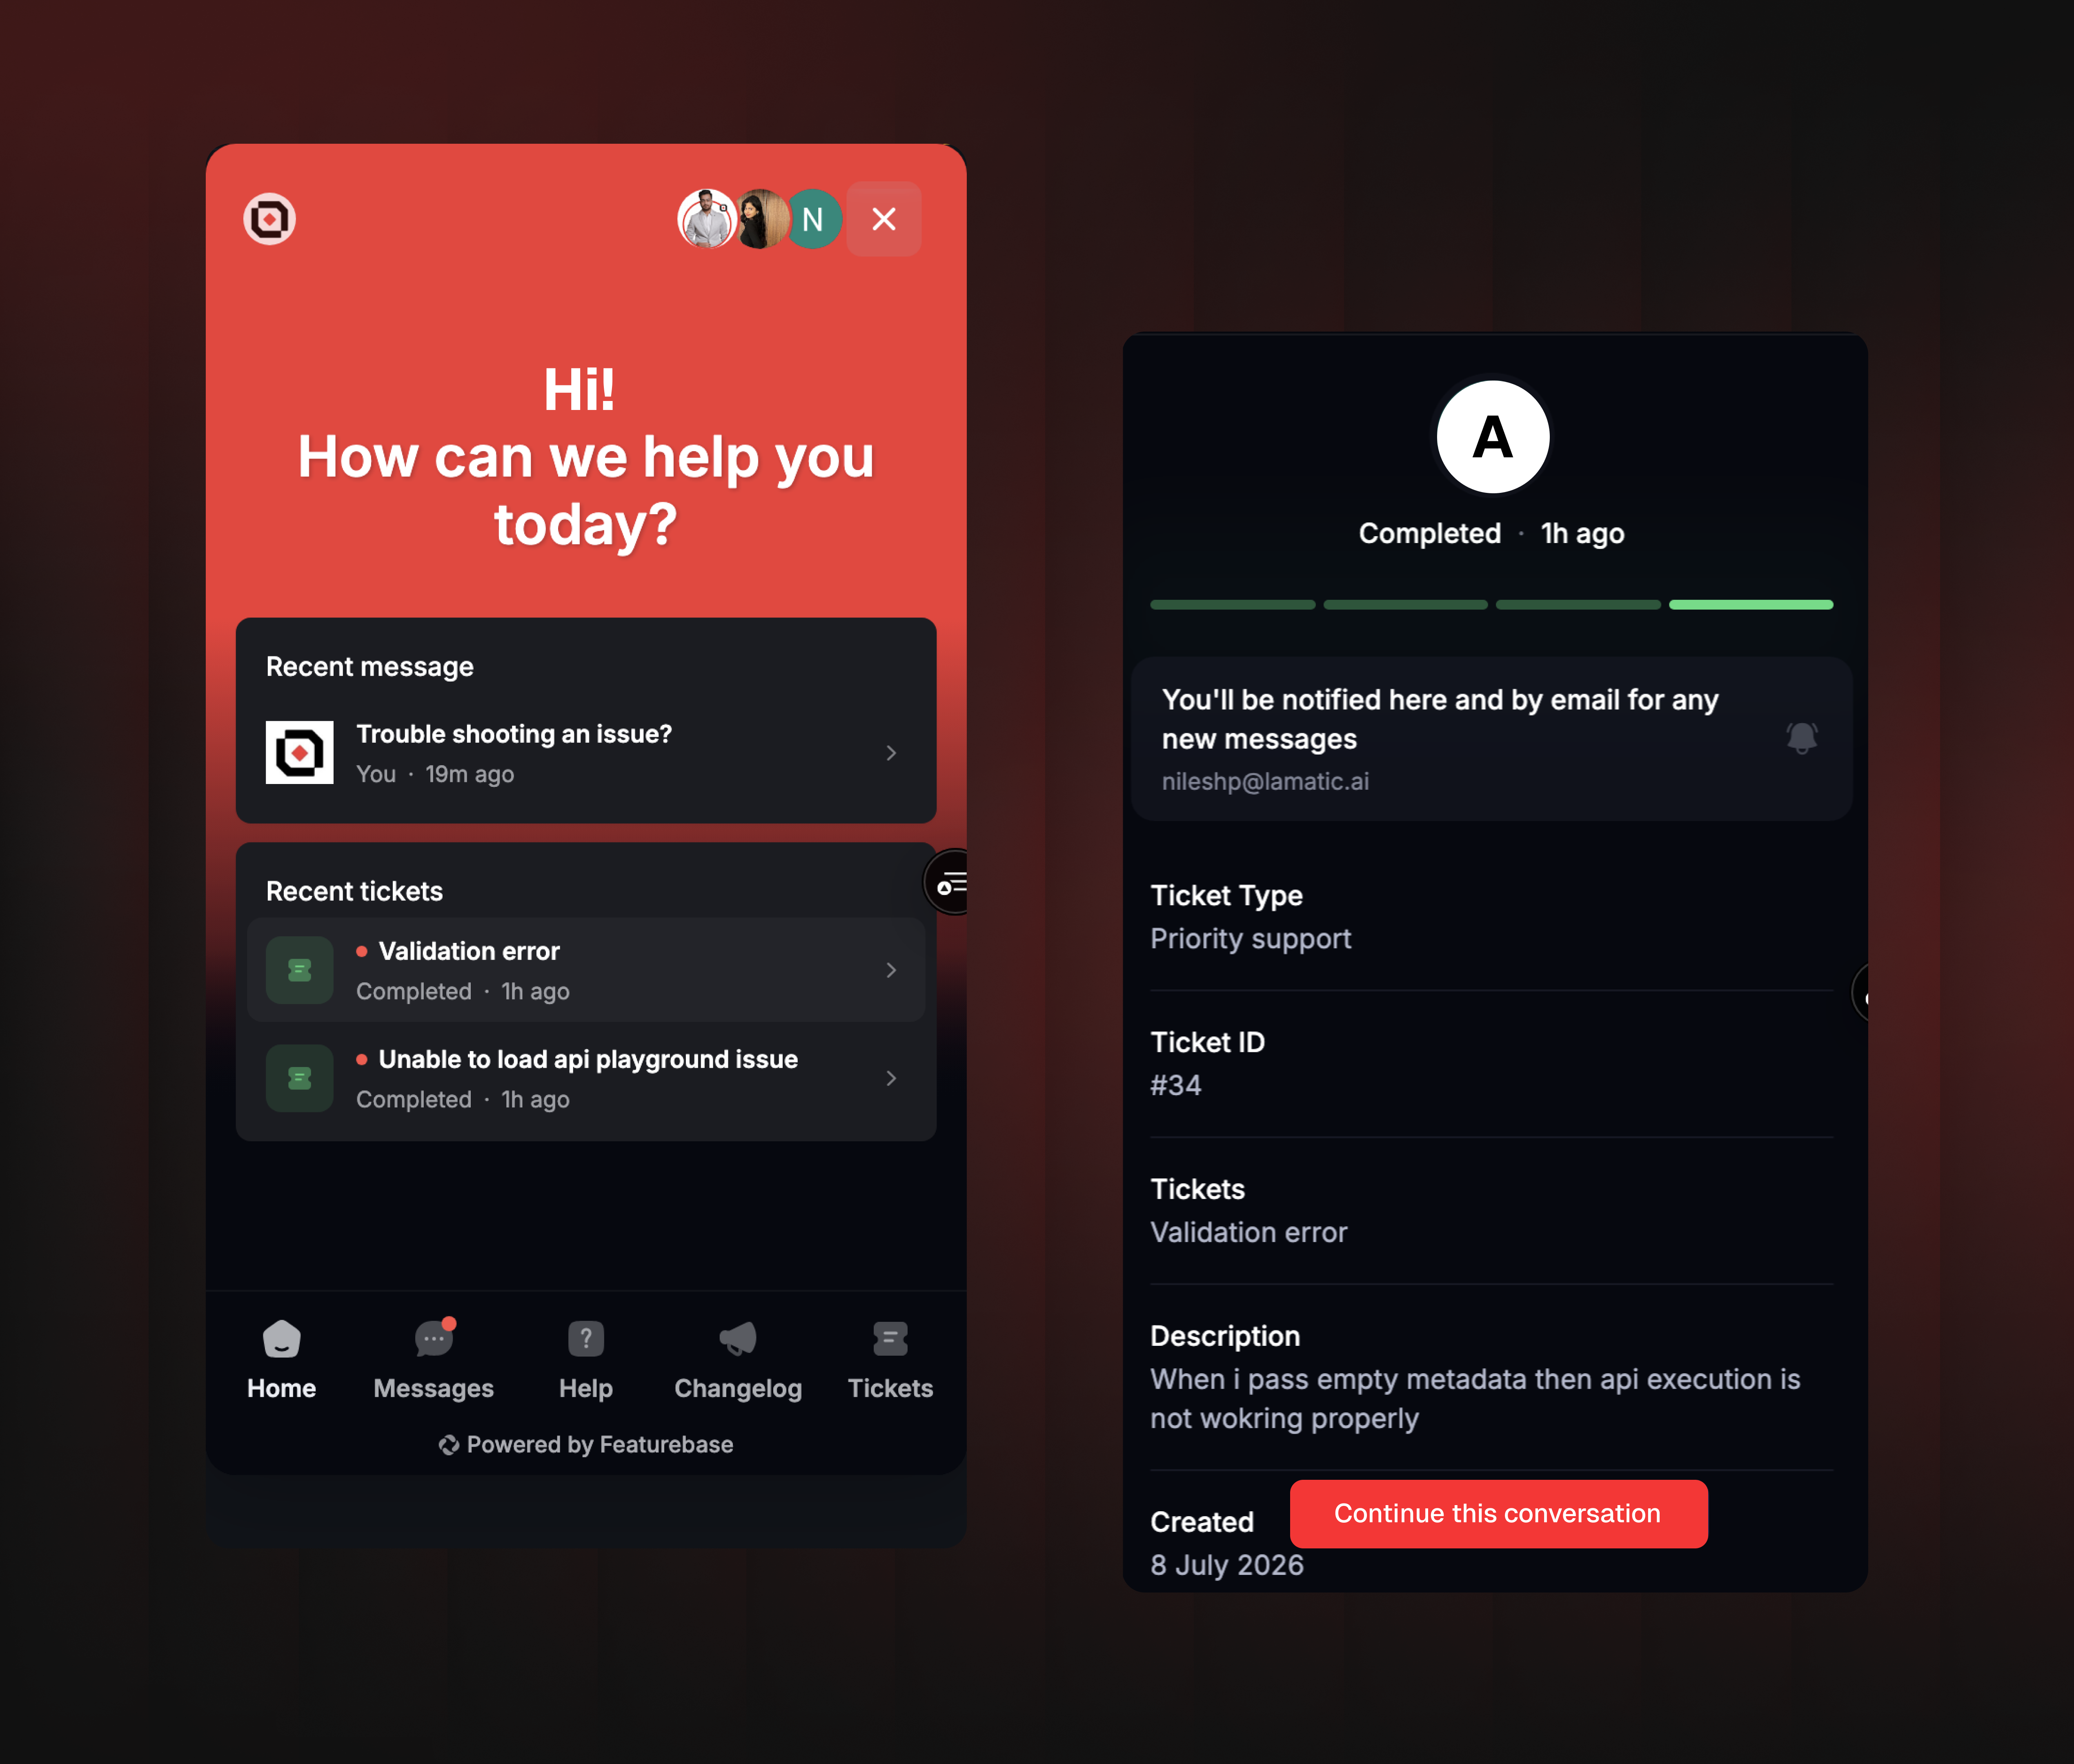
Everything in one place
Once a ticket is open, all communication happens inside it. No more jumping between Slack, email, and the product to figure out what's going on.
Messages: track every conversation, including past ones
Tickets: see status, who's assigned, and full history in one view
Email notifications: get updates without having to check back manually
For now, tickets are only visible to Pro and Enterprise customers when they are active or under review.
June 25th, 2026

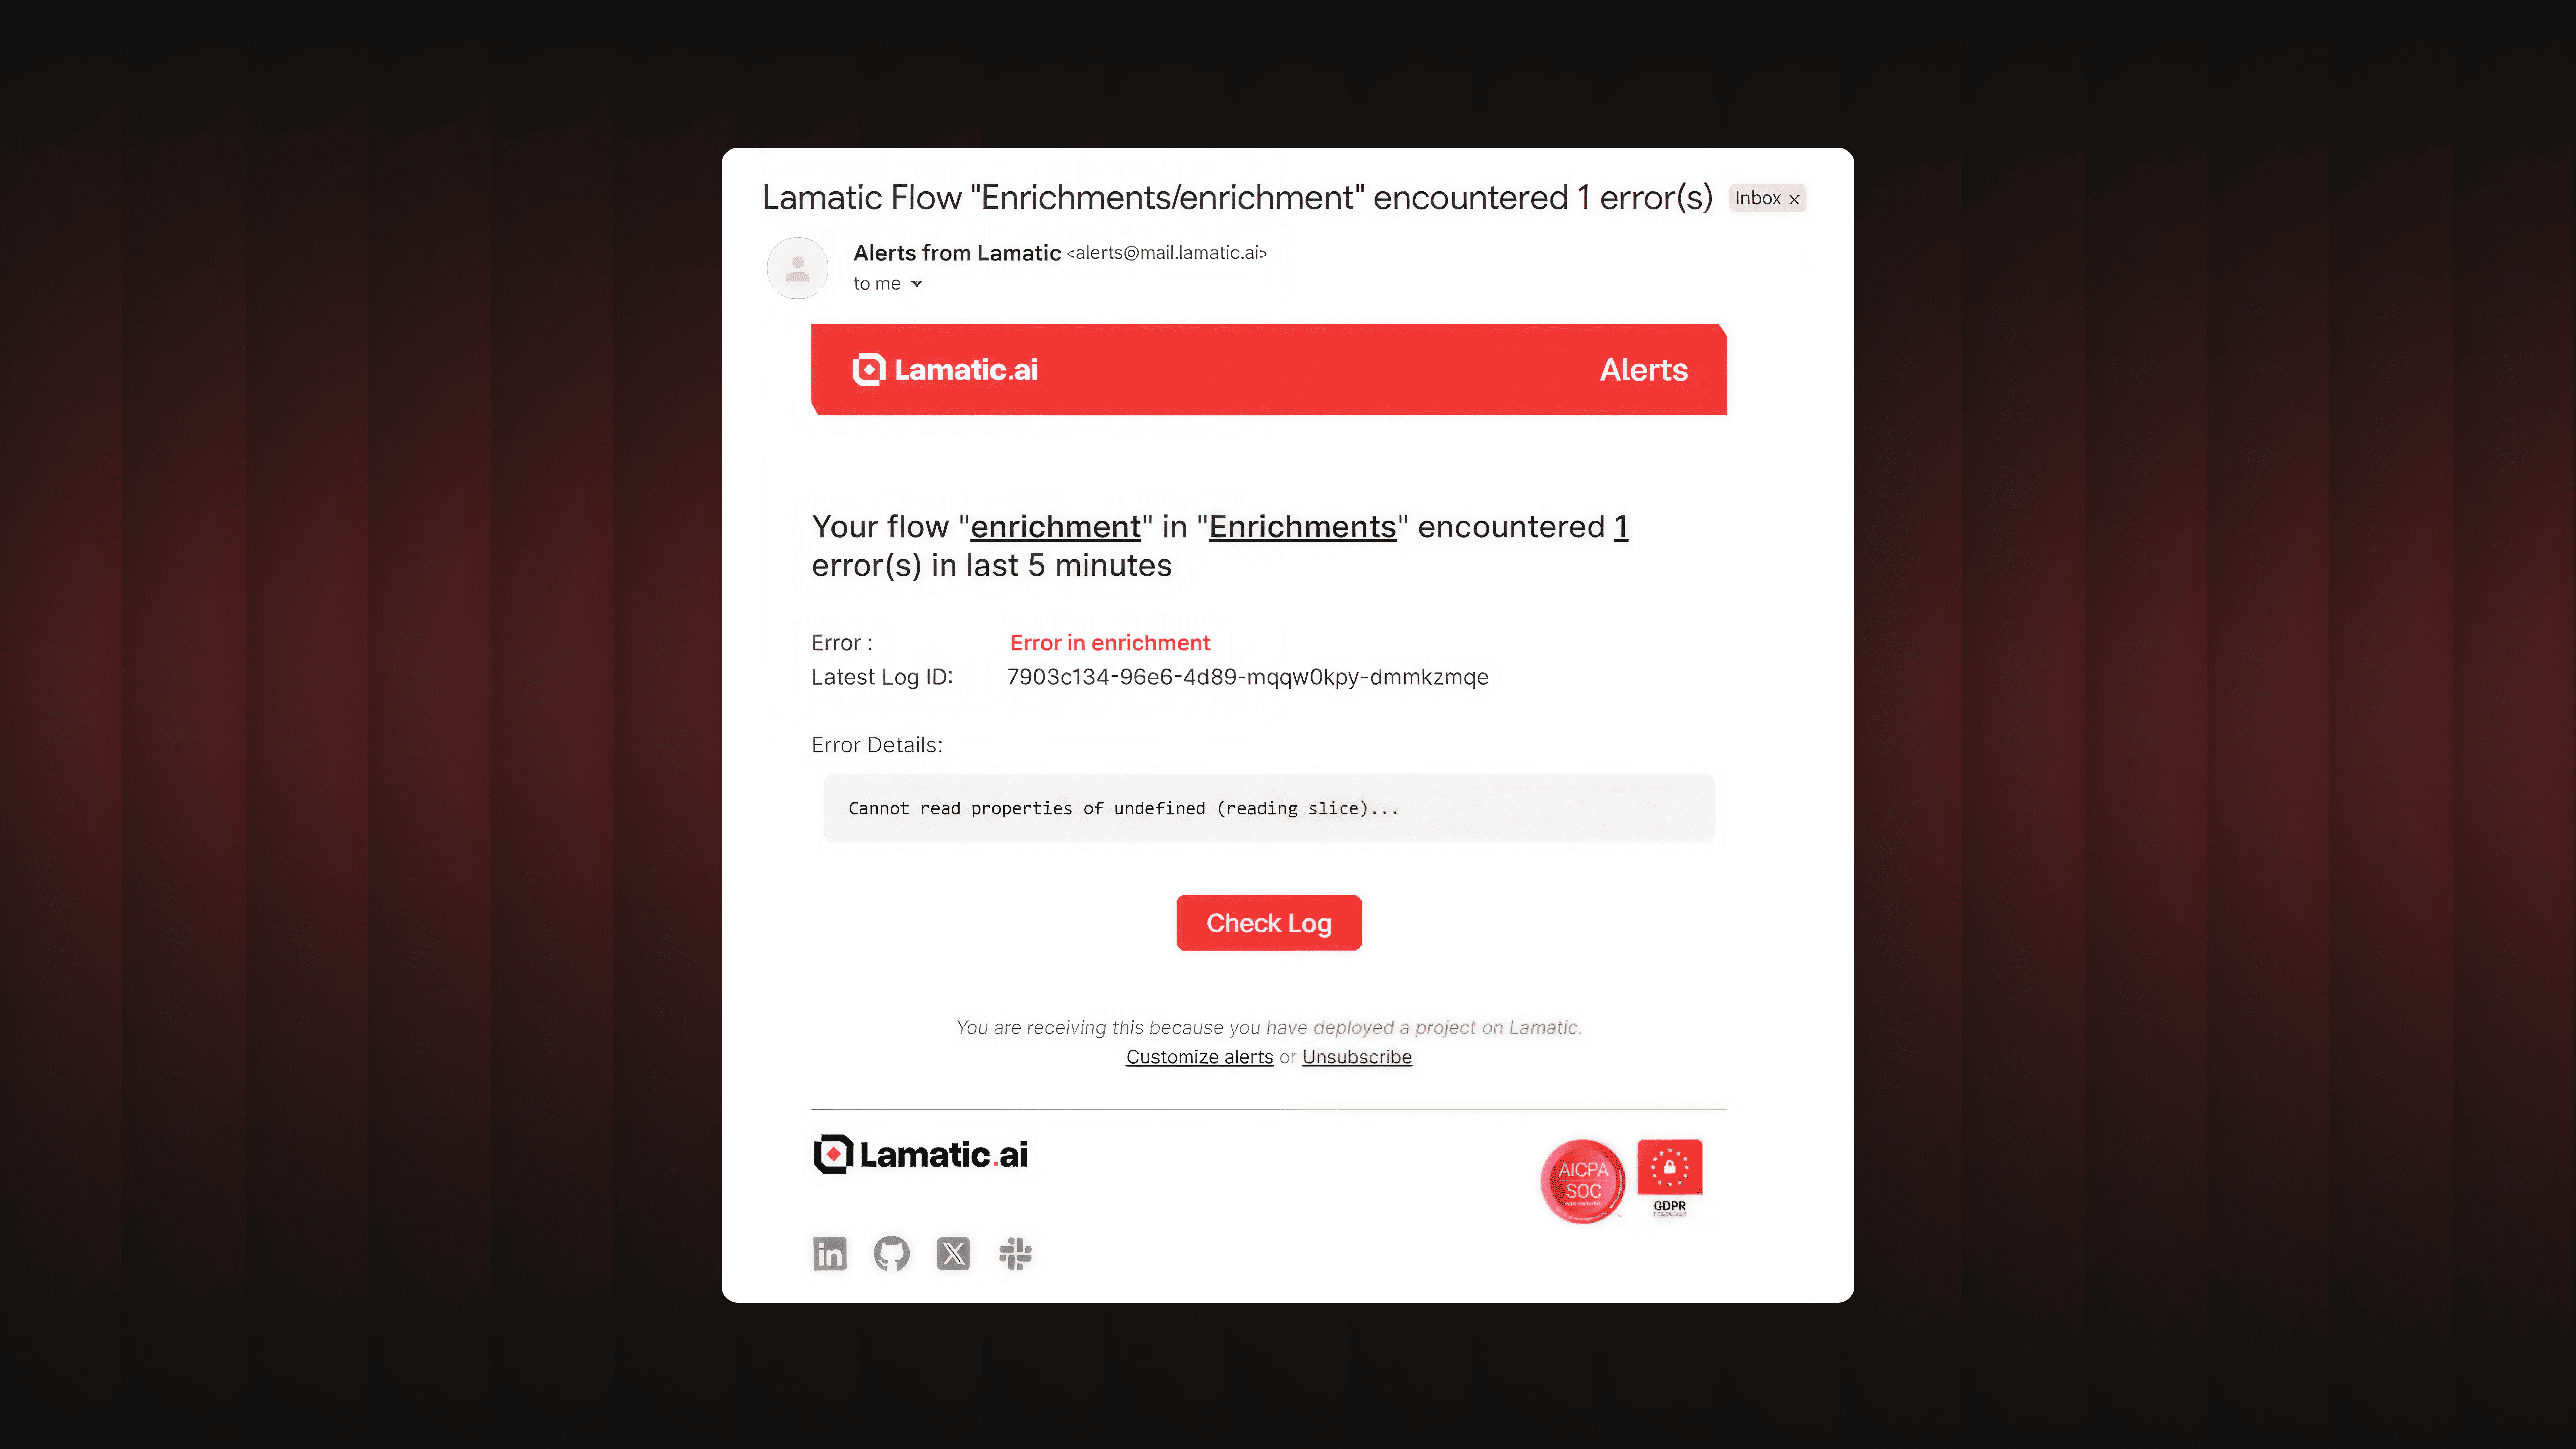
The second a deployed flow throws an error, you get pinged by email, in-app, or both. The alert tells you exactly which flow, which project, what broke, and gives you a one-click link straight to the failing log.
How it works
Deploy a project or flow, and Lamatic starts watching it. If any flow errors out, you get notified within minutes, not when you happen to check back in.
Email alerts
Include the flow name, the project, the exact error, and a "Check Log" button that takes you straight to the failing run.
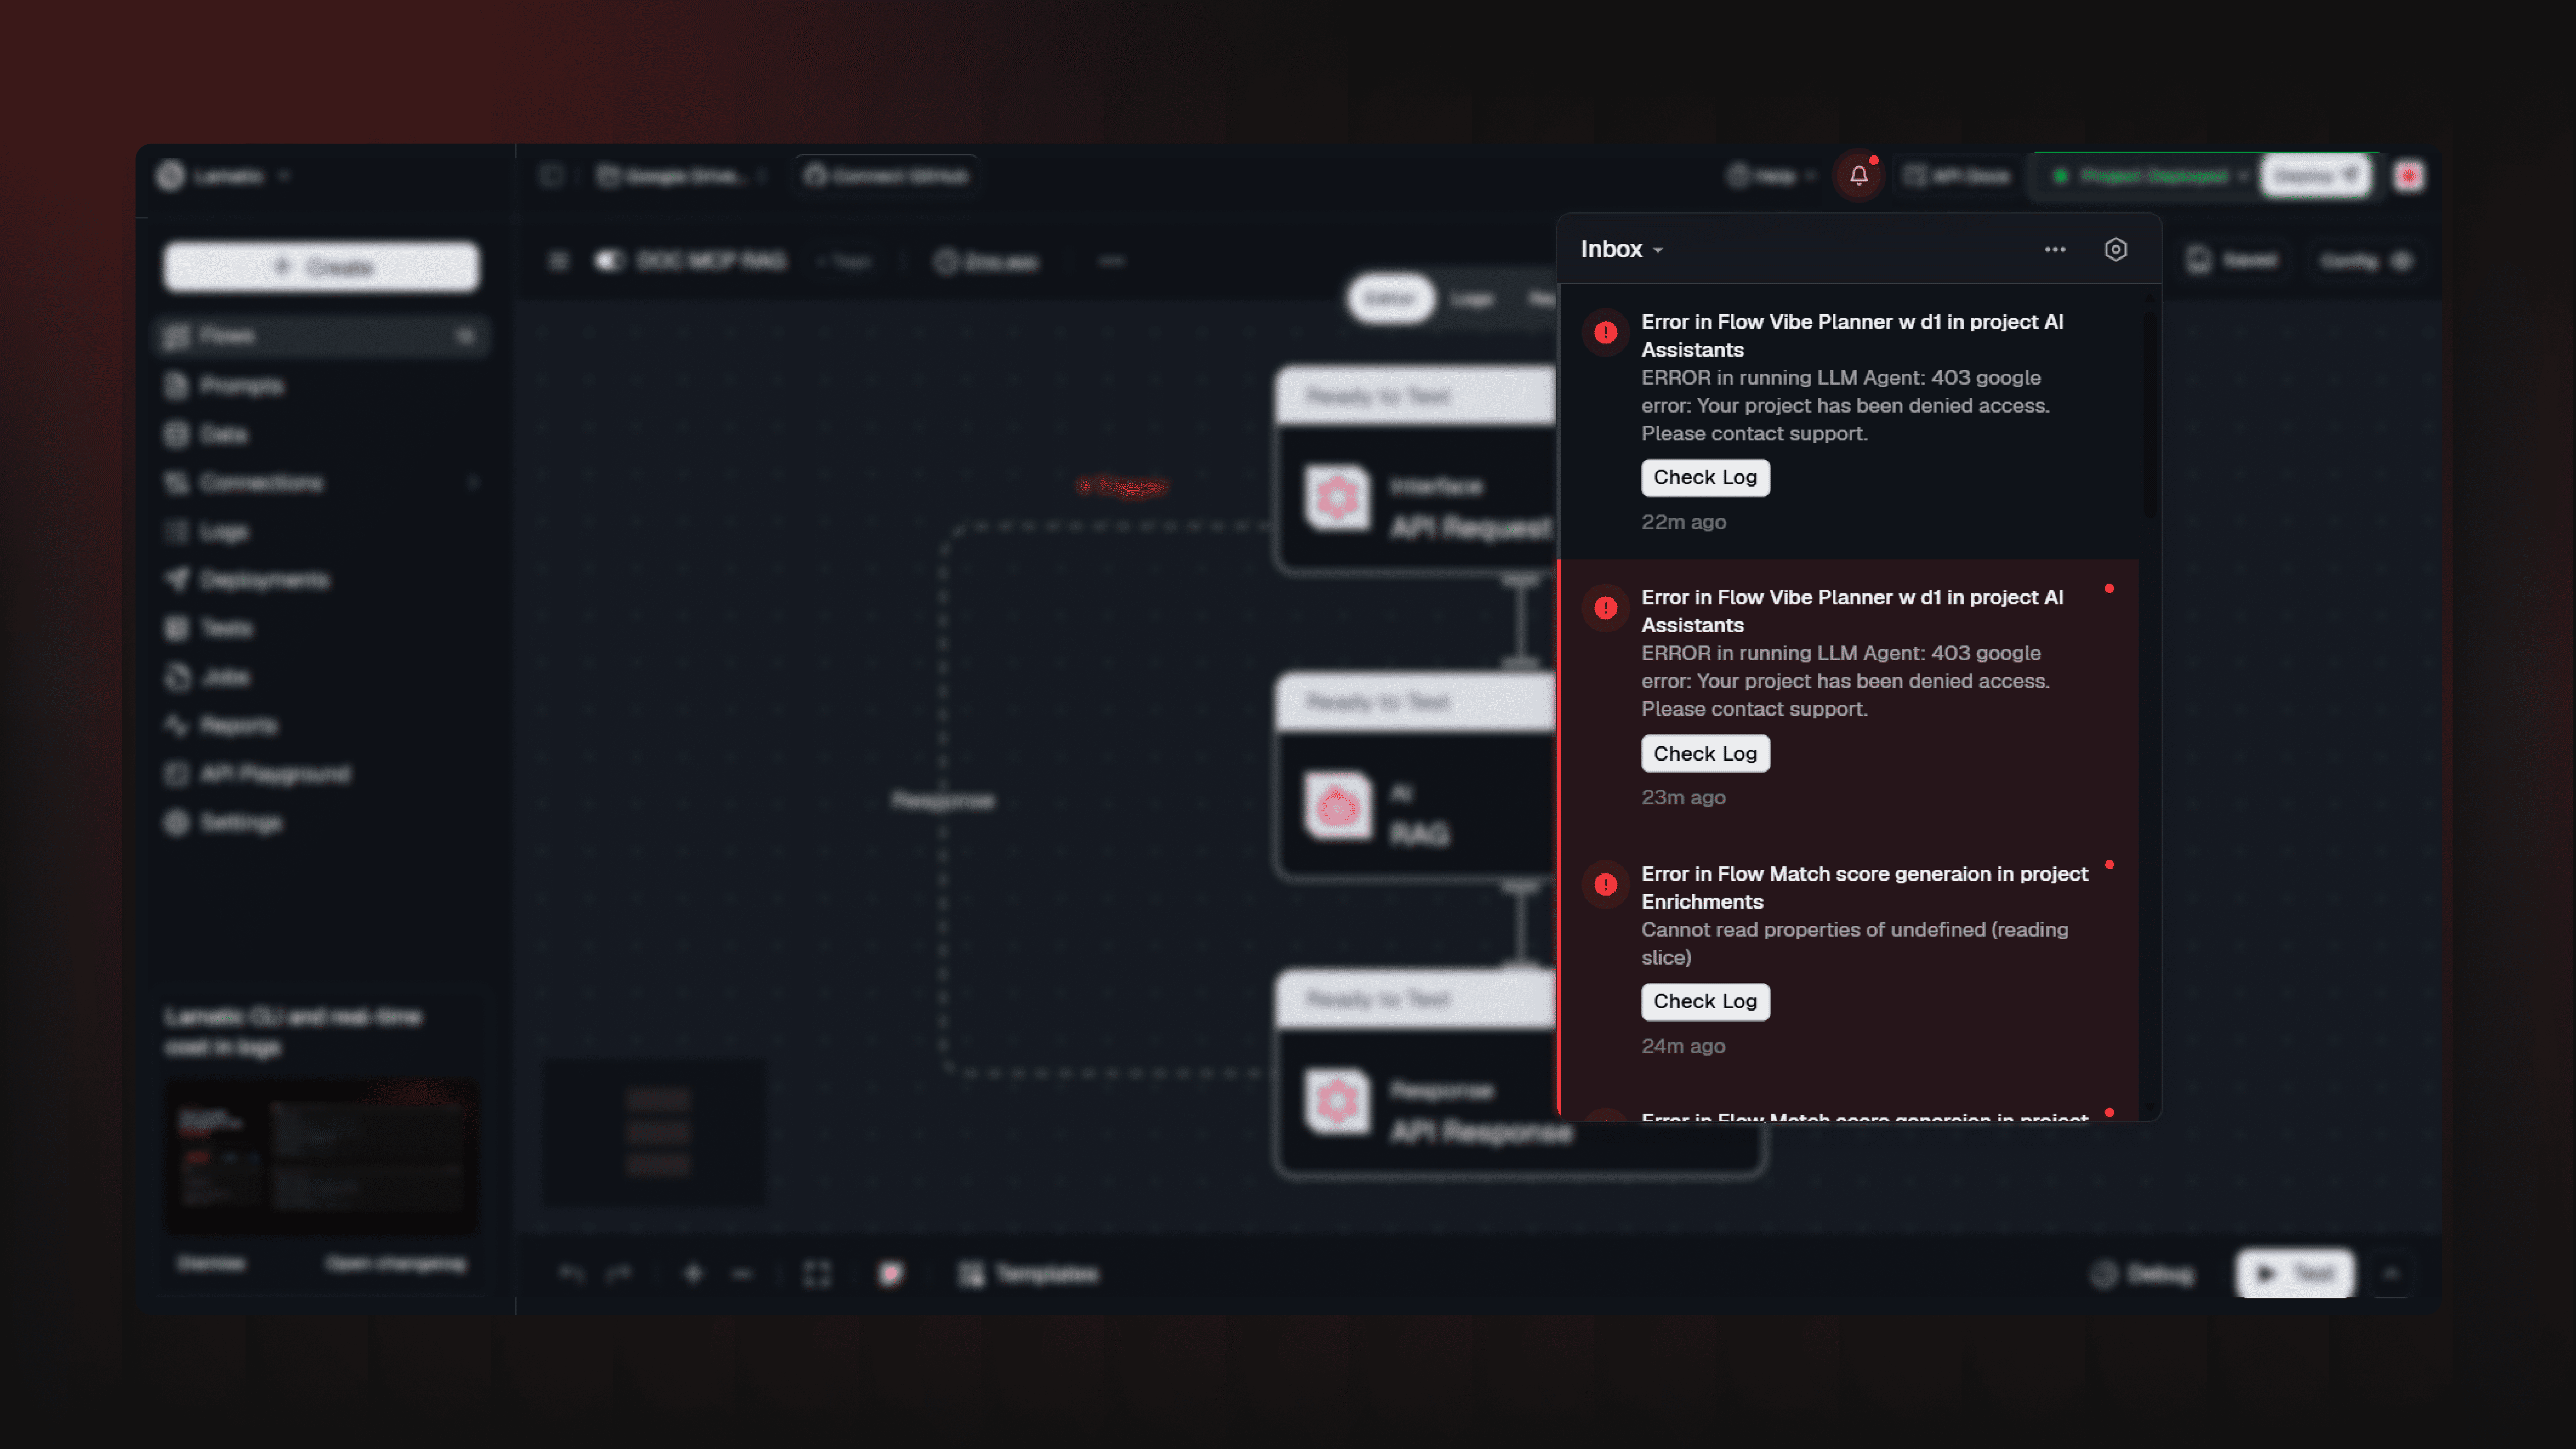
In-app alerts
Show up in the bell icon, stacked in order, so you can group multiple errors without leaving Studio. Alerts fire per error within a 5-minute window, close to real time, without spamming you with retries.
You can also set a delivery schedule right from the notification bell. Choose the days you want email alerts, and set the time range for each day. Mute emails overnight or on weekends without missing a thing. Outside that window, email pauses. Critical notifications still reach you every time, regardless of the schedule.
You're in control
Not every alert needs to reach every person, so we built that in too.
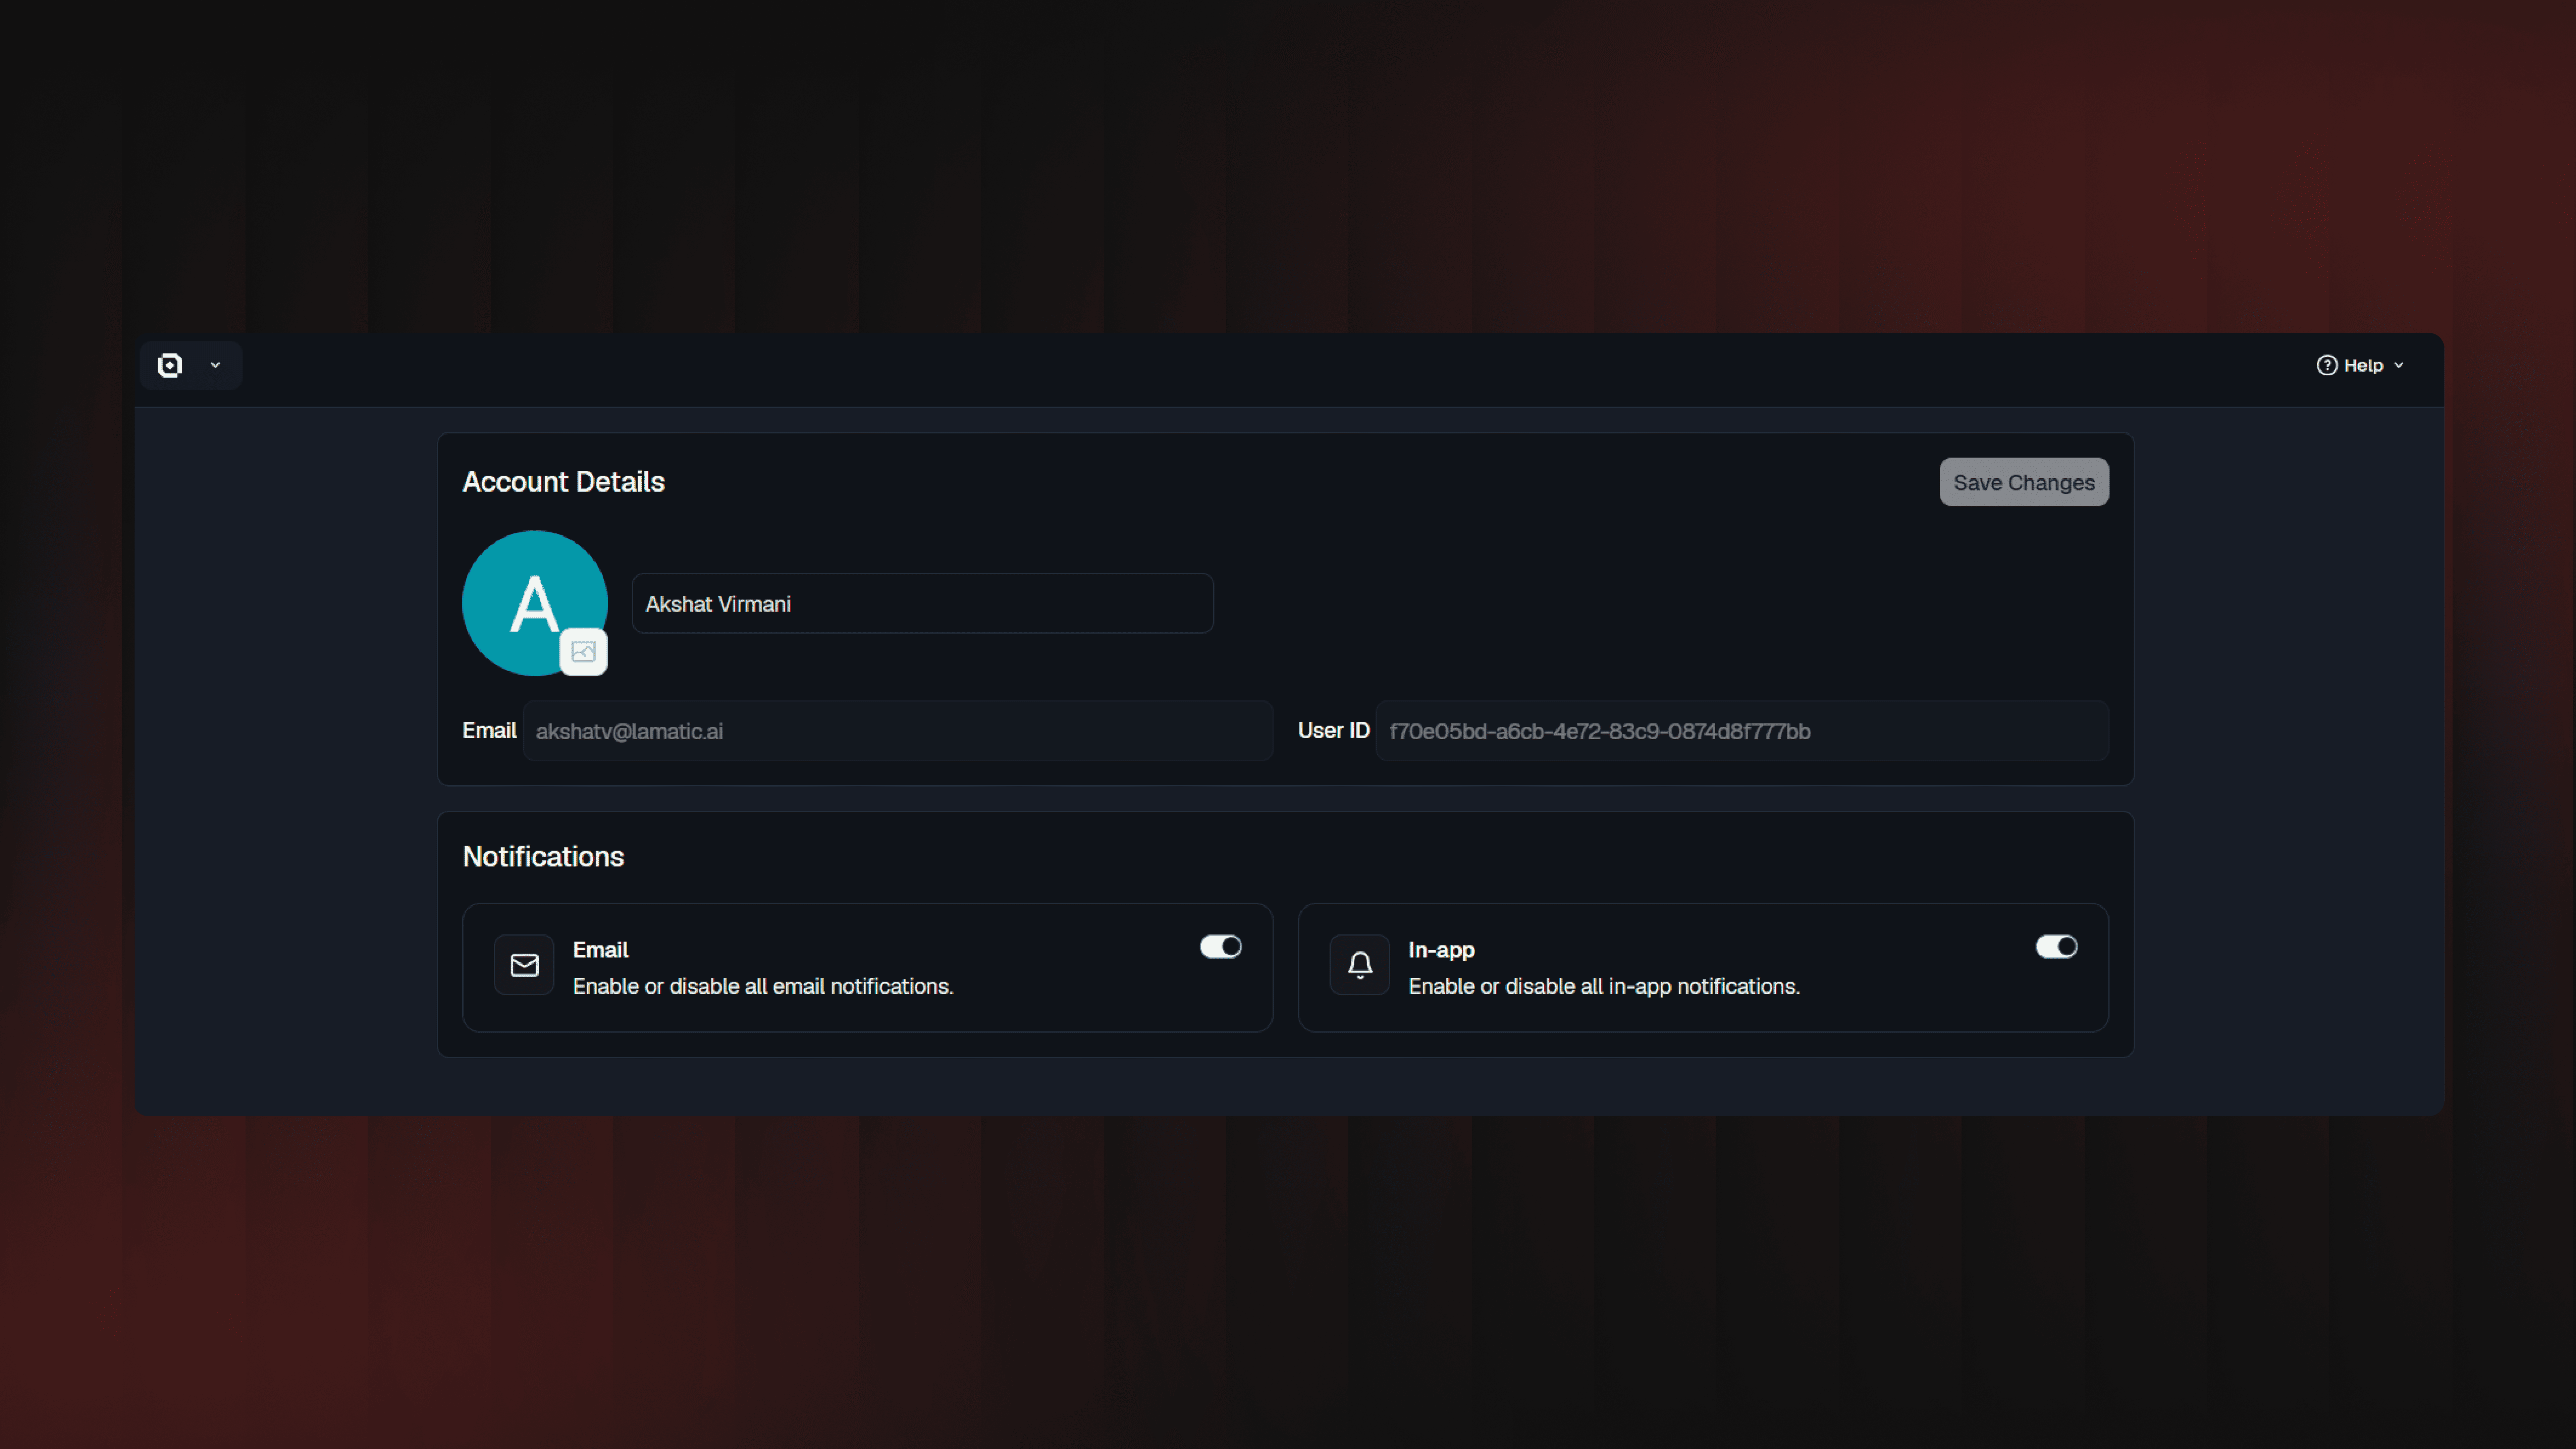
Your profile
Has its own notification switch; turn email or in-app alerts on or off for yourself, across every project you're part of.
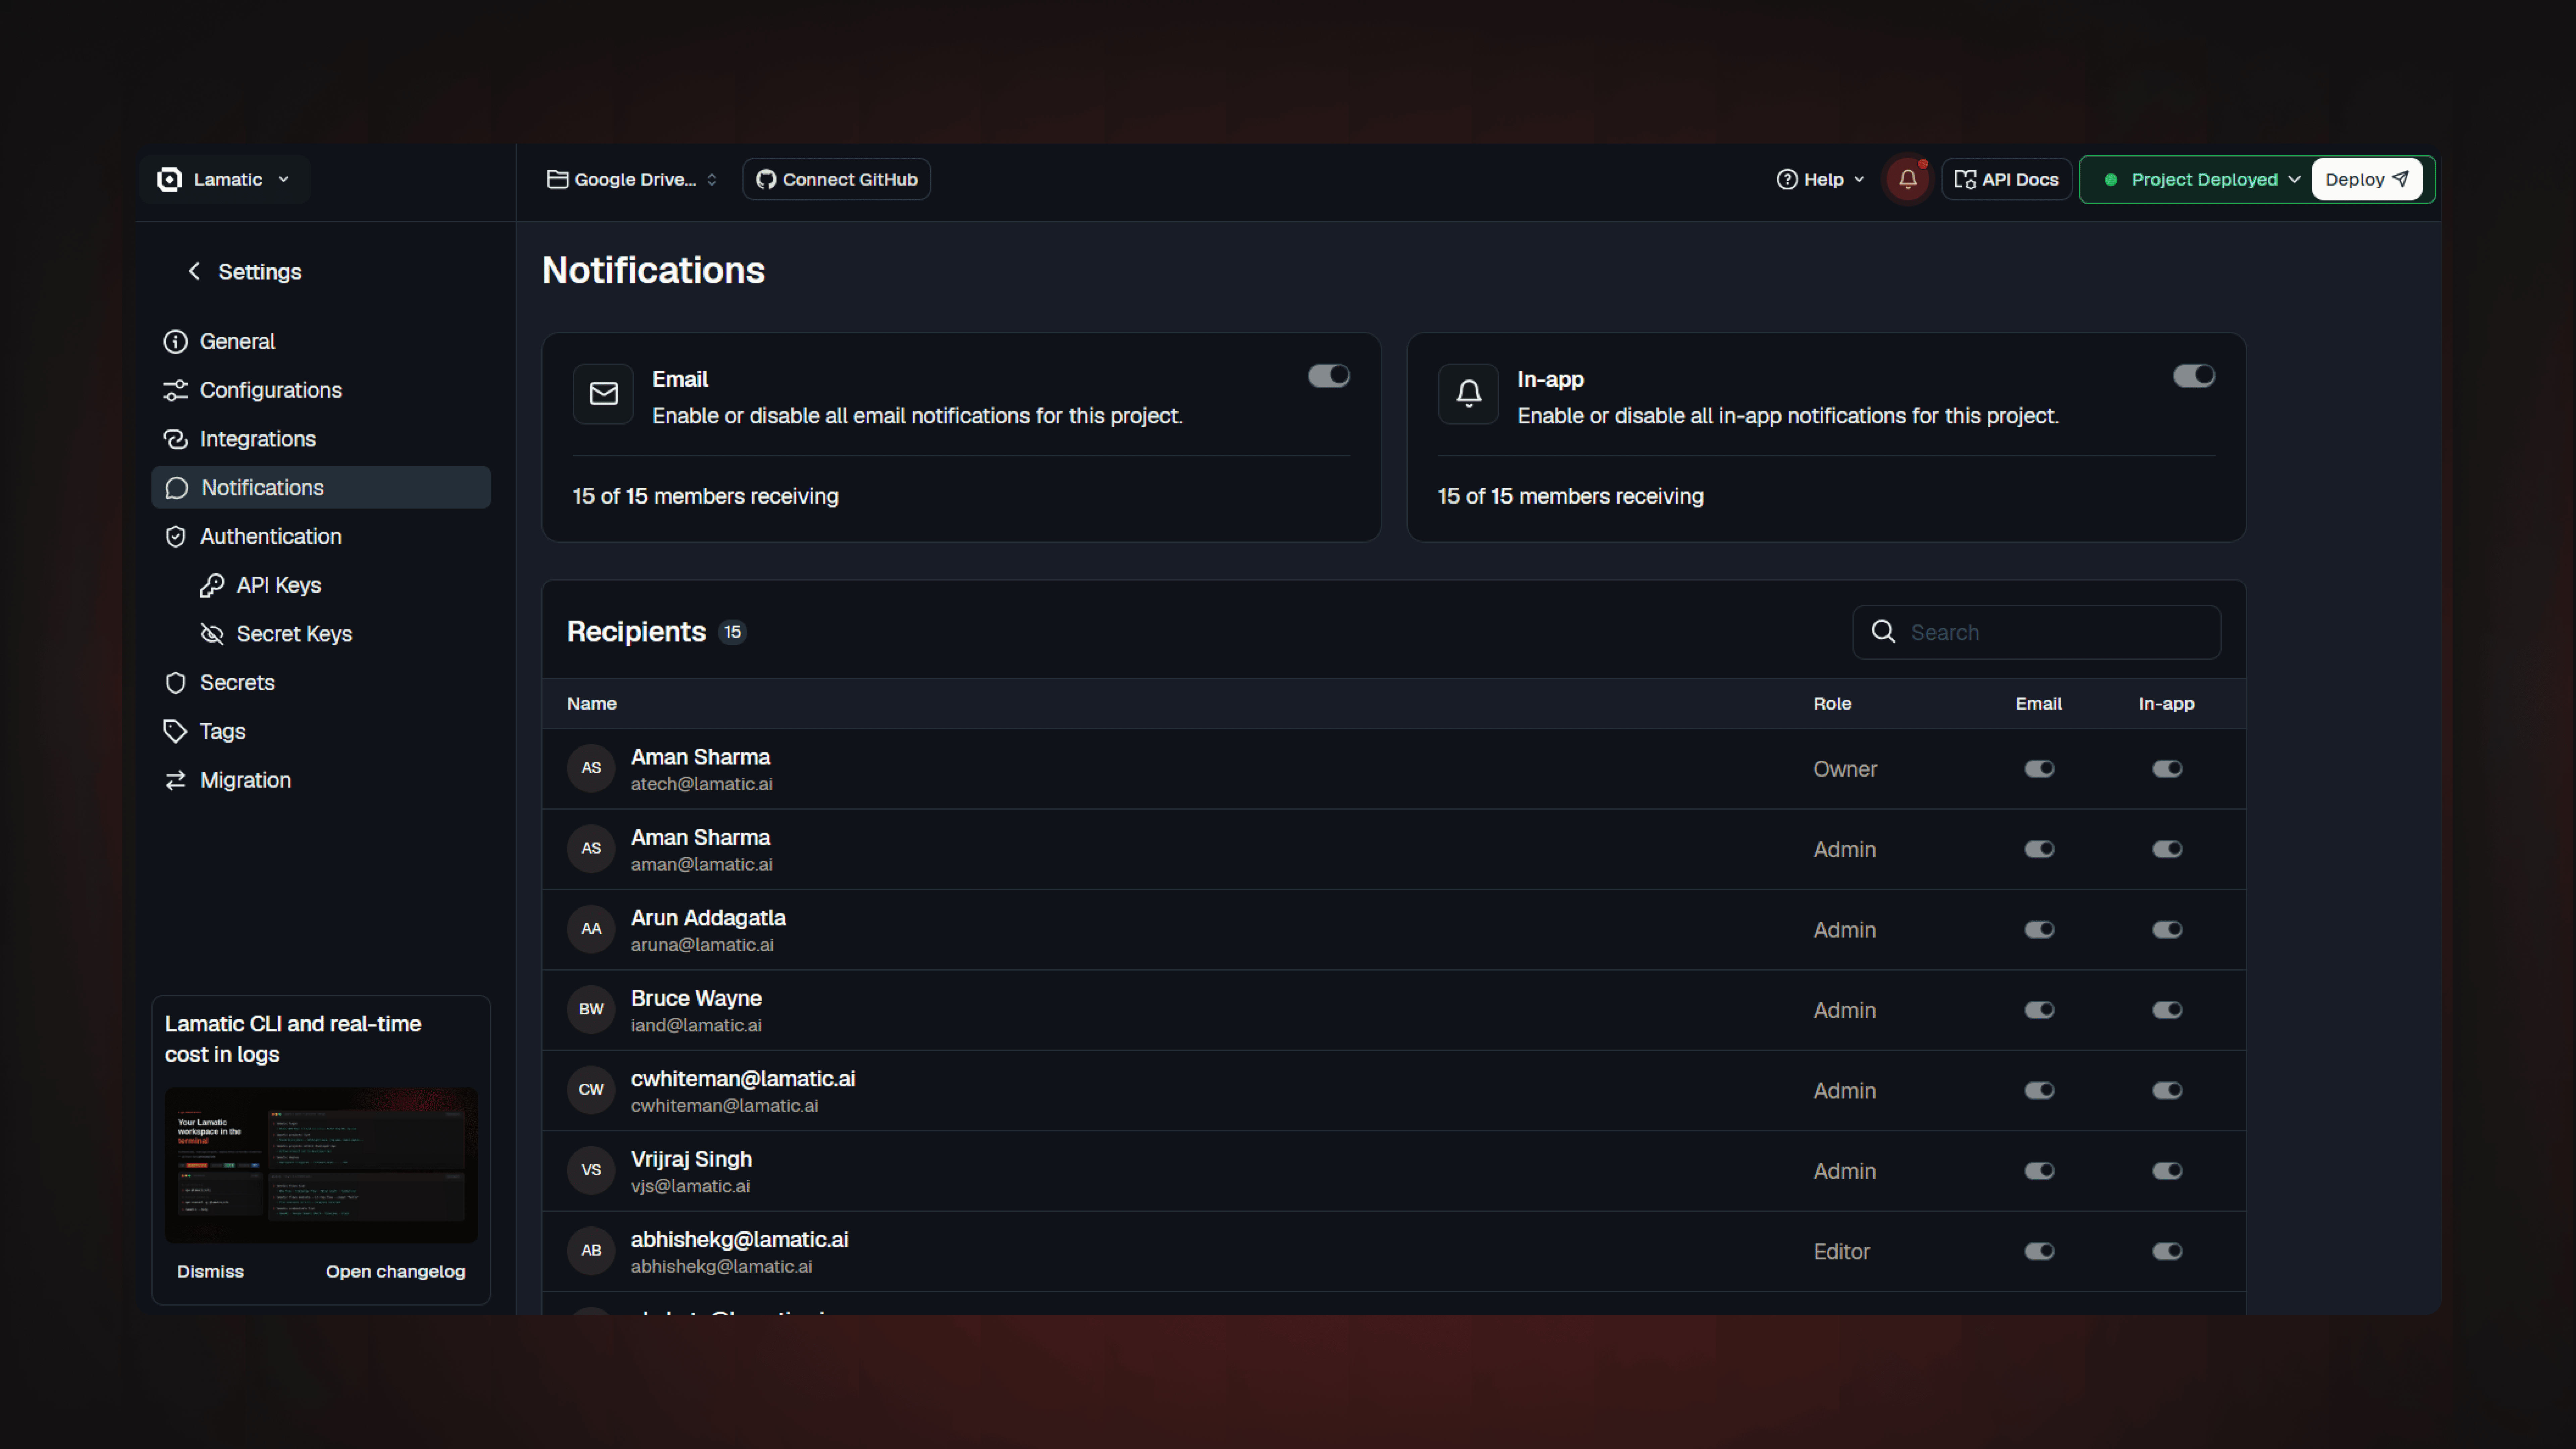
Project settings
Each project has its own Notifications settings: toggle channels for the whole team and choose exactly which teammates get pinged and on which channel. Three people on the project? Decide individually if each one gets an email, an in-app ping, both, or neither.
June 18th, 2026
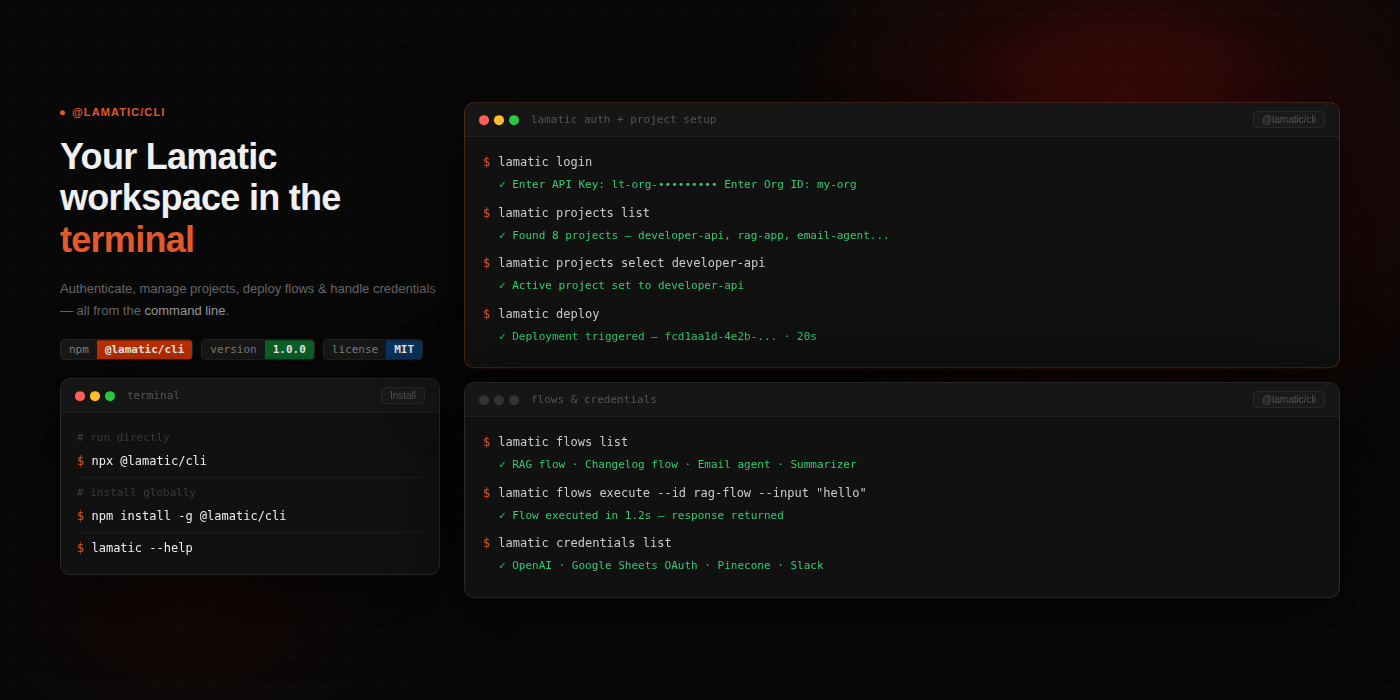
Two things in this release. The Lamatic CLI is now on npm. Manage your entire org from the terminal. And logs now show real-time model pricing per run, so you always know what a flow costs.
New Lamatic CLI: manage projects, flows, and deployments from the terminal
The official Lamatic CLI is live on npm. Create projects, manage flows, handle deployments, add model credentials and integrations all without opening Studio.
npm install -g @lamatic/cliProjects: create, list, download locally, delete
Flows: create, list, rename, activate/deactivate, delete
Deployments: trigger, list, and inspect deployment details
Contexts: create and manage vector and memory stores
Models & Integrations: add and list credentials
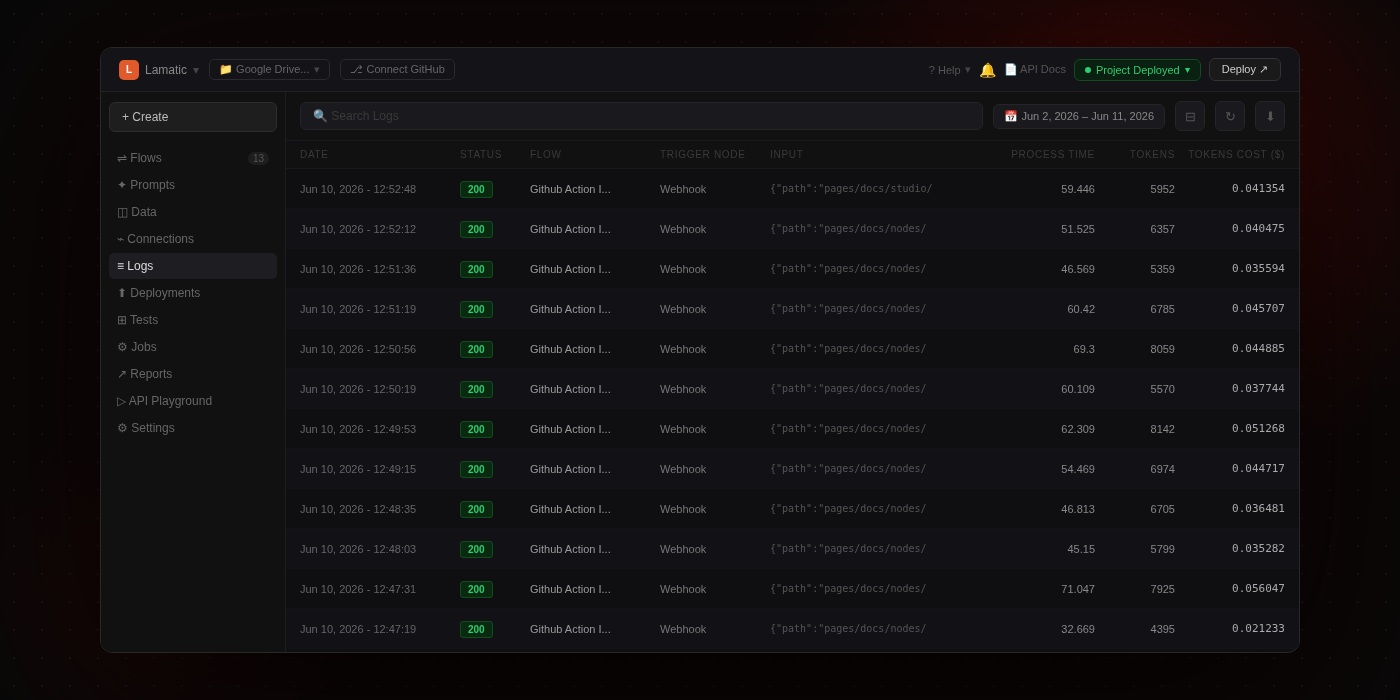
Improved Logs: real-time model pricing per run
The logs list now shows real-time cost per run directly in the table. No more guessing what a flow costs, open Logs and the numbers are right there.
June 3rd, 2026
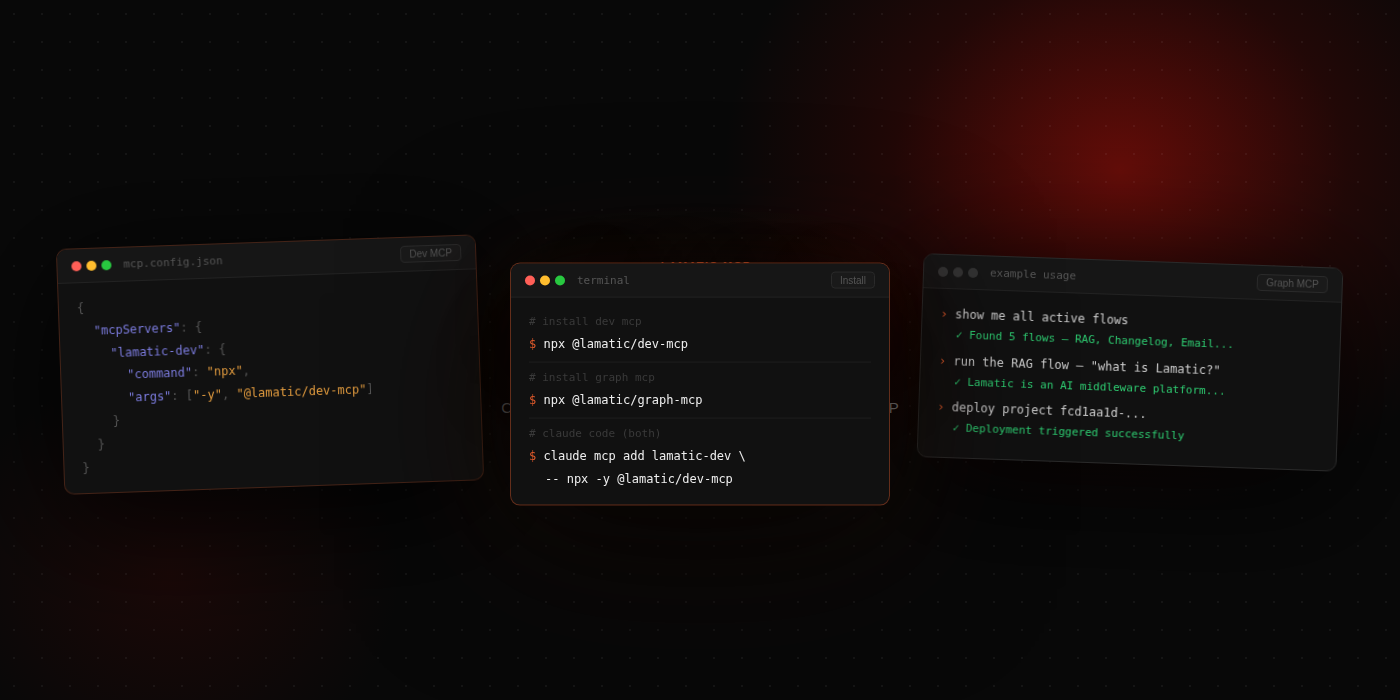
Two new MCPs in this release. Graph MCP turns your deployed flows into tools your AI agent can call directly. Dev MCP gives Claude, Cursor, and Copilot full control over your Lamatic org projects, flows, credentials, and deployments, all from natural language. And deployment details now show flow tags so you always know what's live.
New Graph MCP: run your deployed flows straight from your AI agent
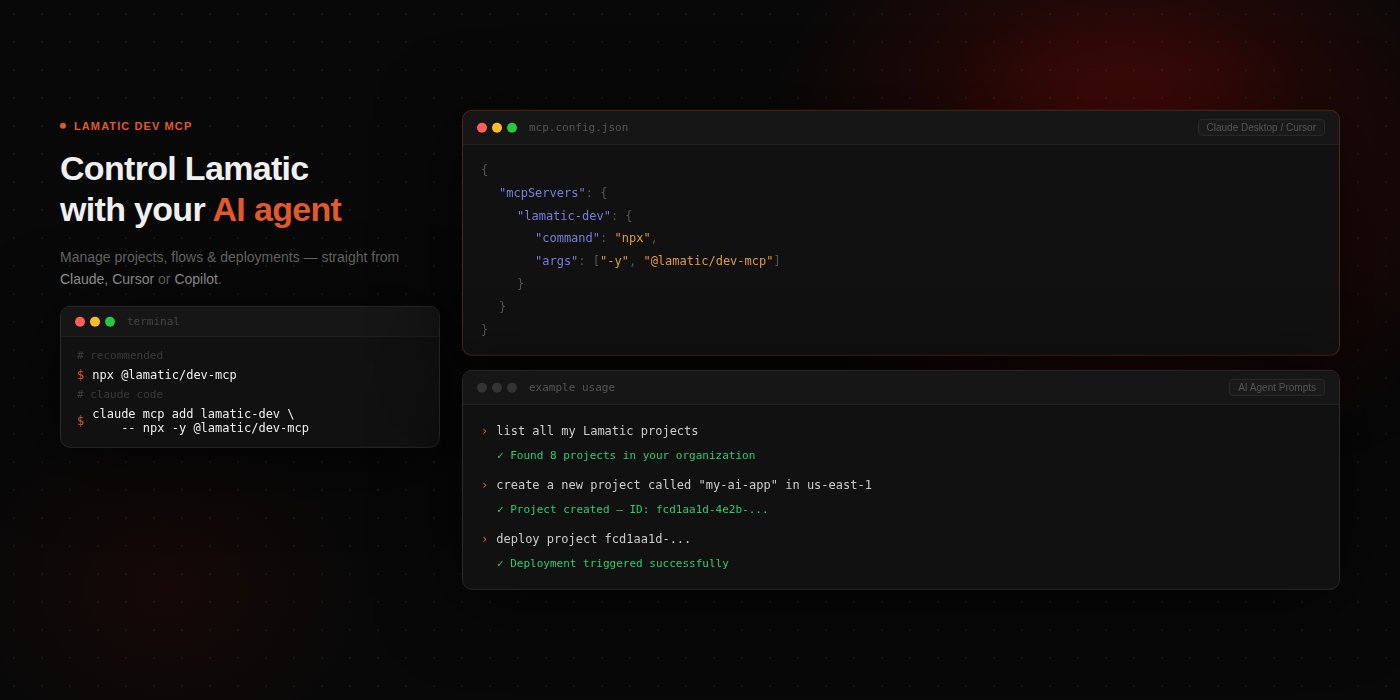
Your deployed Lamatic flows are now executable as tools inside Claude, Cursor, or GitHub Copilot. Point Graph MCP at your project, load your active flows, and your agent can trigger any of them by just describing what it wants to do.
Works with API, Chat Widget, Search Widget, and Webhook triggers
Auto-maps natural language to the right flow and payload
Works with Claude Code, VS Code, Claude Desktop, Cursor and more
New Dev MCP: manage your entire Lamatic org from your editor
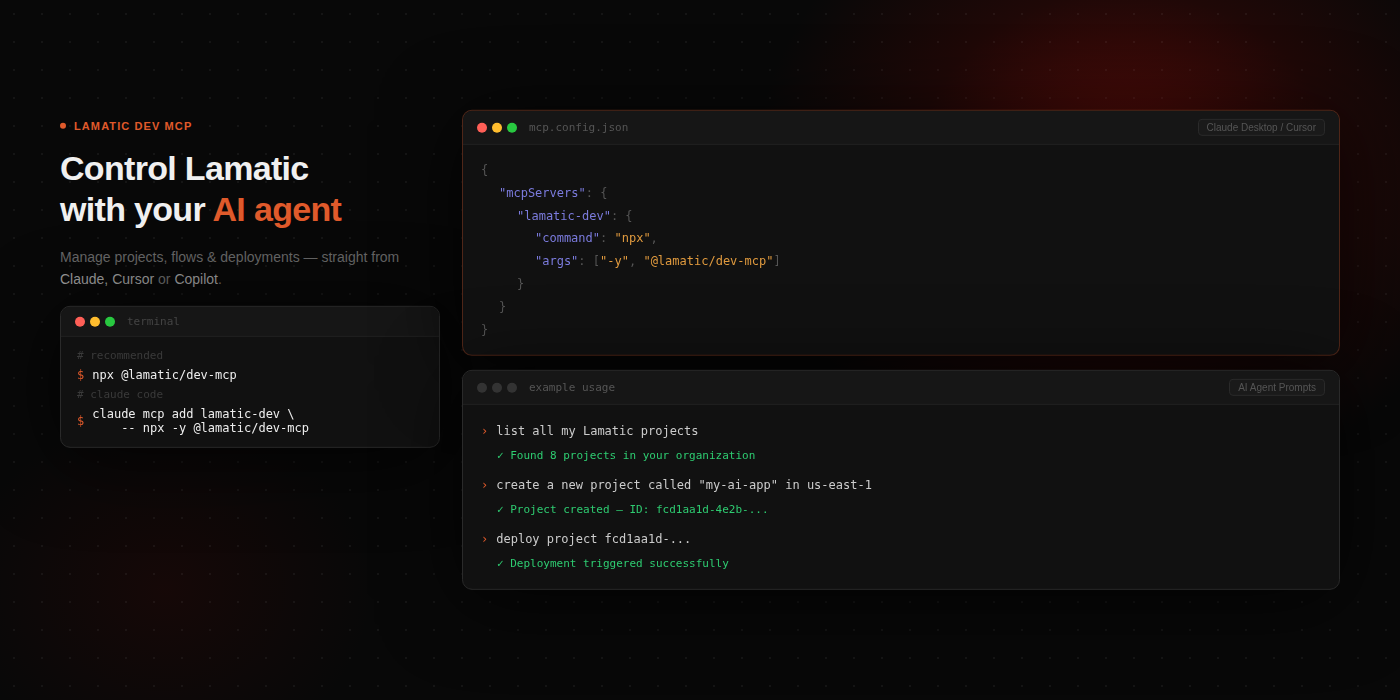
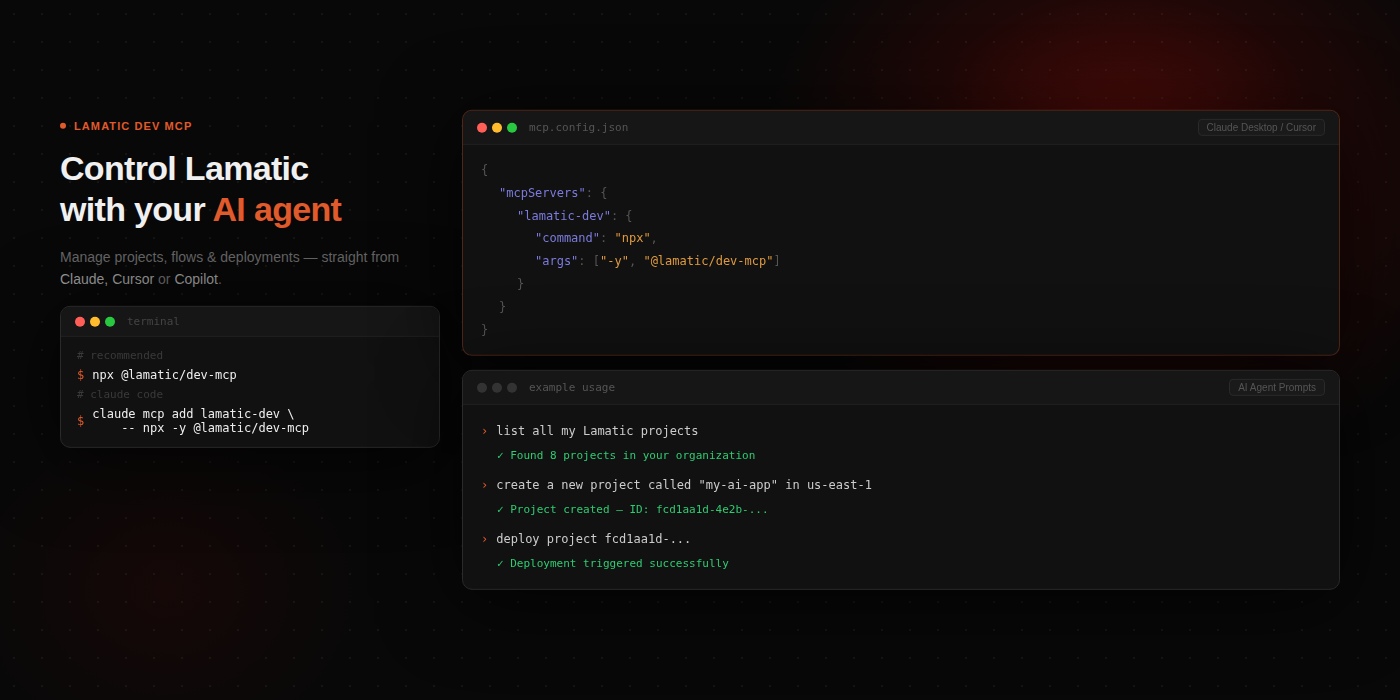
Dev MCP gives your AI agent hands-on access to everything in your Lamatic org. Create projects, build and update flows, manage credentials and handle deployments without opening Studio.
Projects: create, rename, deploy, and delete
Flows: create, update nodes and edges, activate, deactivate
Credentials: add and manage model and integration credentials
Contexts: create and manage vector and memory stores
And more
Improved Deployments: flow tags are now visible in deployment details
When you deploy a project, deployment details now show the tags attached to each flow, making it easier to filter, identify, and track what's live.
May 26th, 2026

Two things in this release. The Tables Node provides full CRUD operations for structured data directly within your flows. And when a flow fails, logs now show you exactly which node broke and why.
New Tables Node: query, insert, update, and delete without leaving Studio
You can now read and write structured data inside any flow using the Tables Node. It connects directly to your Lamatic Data Tables and handles the full range of operations, no external database tooling needed.
Select rows with filters, sorting, and pagination
Insert single or multiple records from flow data
Update records matching a where clause
Delete records by condition
Raw SQL for anything the visual builder doesn't cover
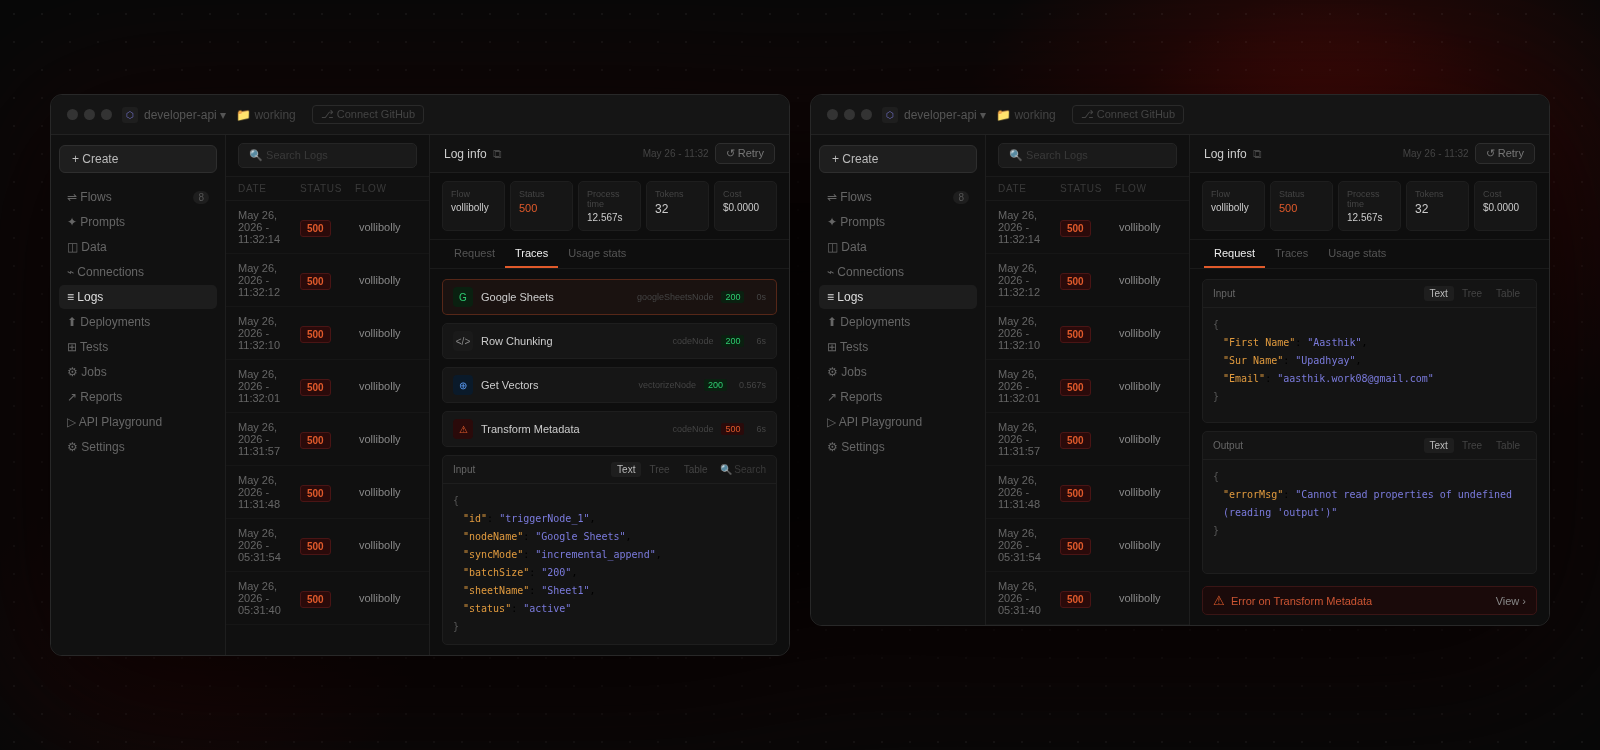
Improved Logs: per-node error details when a flow fails
When a flow runs and hits an error, the log detail view now shows you the exact node that failed and the specific error it threw, such as input, output, and error message, all in one place. No more guessing which step broke.
May 20th, 2026
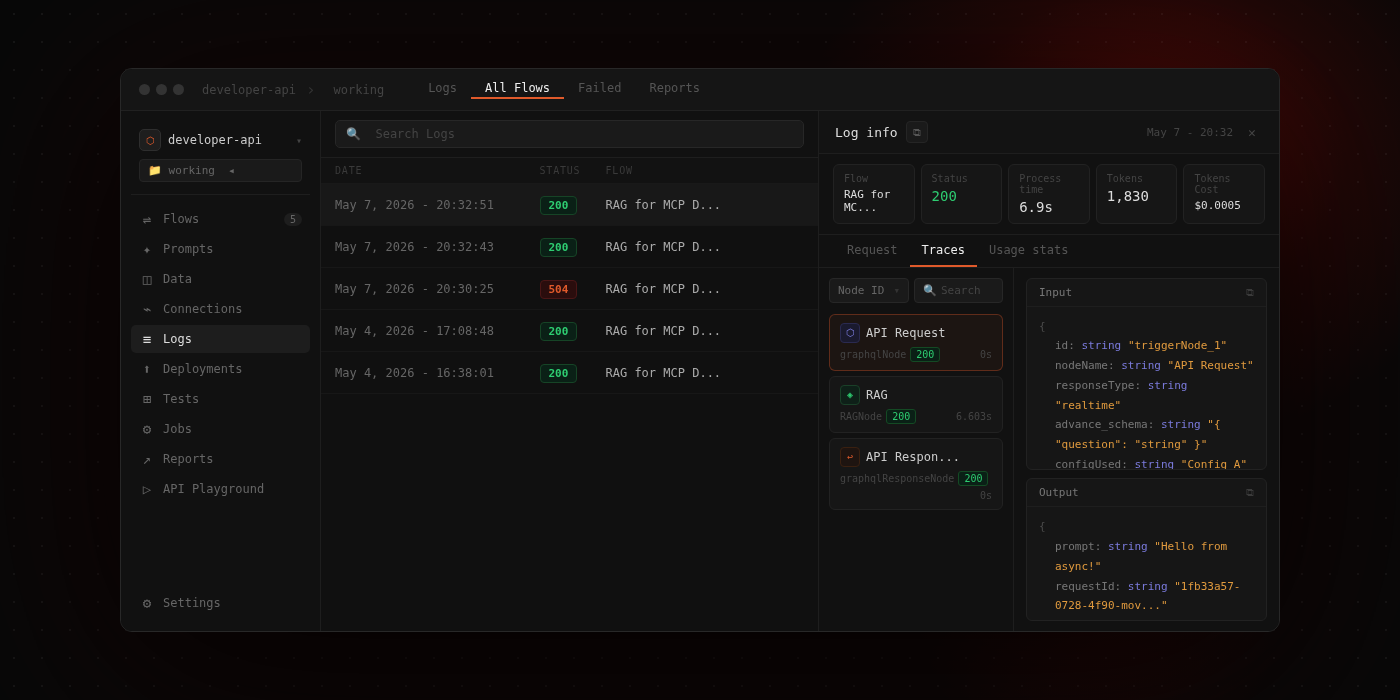
Three things in this release. Log details load faster with a redesigned view. The debugger gets UX changes that make quality testing cleaner. And the Lamatic Docs MCP is live; query the docs from Claude, Cursor, or Windsurf without leaving your editor.
New Docs MCP: query Lamatic docs from your AI assistant
The Lamatic Docs MCP gives Claude, Cursor, Windsurf, and any HTTP MCP client direct access to Lamatic documentation, powered by a RAG pipeline built on Lamatic itself. No API key, no account required.
Works with Claude Desktop, Cursor, Windsurf, Cline and more
Single tool: Ask any question, get a precise answer with references
Improved Log details: faster load, cleaner trace view
Log detail pages have been redesigned to load faster and make it easier to follow the full trace of a request.
Faster load times across all log detail views
Redesigned layout that makes request traces easier to scan
Clearer node output display for quicker root cause identification
Improved Debugger: flow quality testing that stays out of your way
The debugger UX is tightened up so testing a flow feels less like a separate task and more like part of building. Spot issues, iterate faster, move on.
Streamlined interface with less friction between triggering a test and reading the result
Better output readability in debug mode across complex flows